Estimated Value: $302,988 - $387,000
3
Beds
2
Baths
1,613
Sq Ft
$219/Sq Ft
Est. Value
About This Home
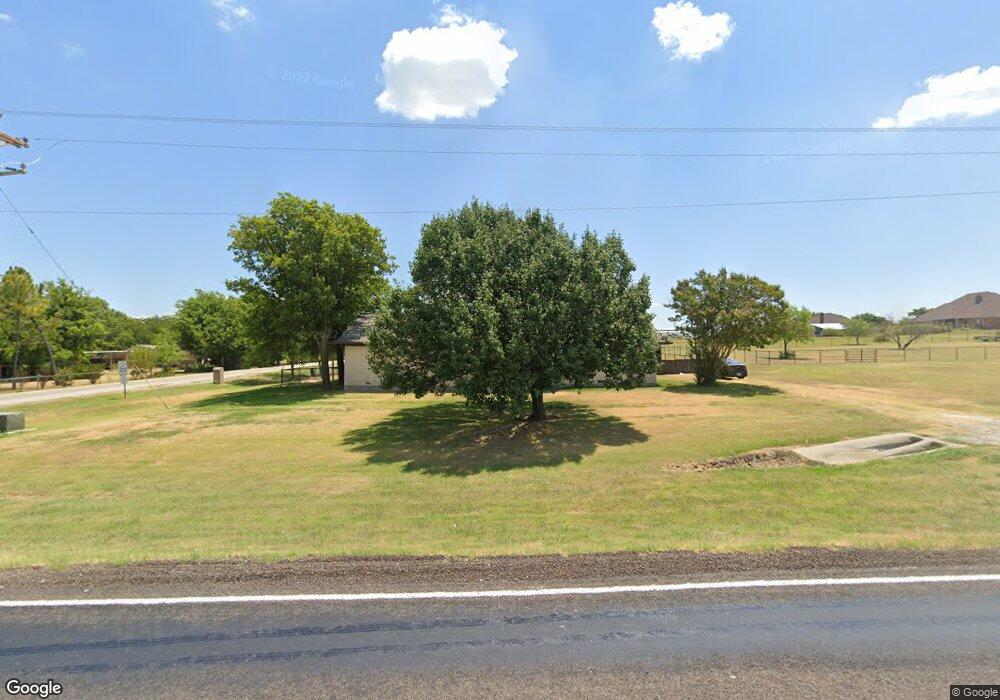
This home is located at 6241 Hawkeye Rd, Krum, TX 76249 and is currently estimated at $353,497, approximately $219 per square foot. 6241 Hawkeye Rd is a home located in Denton County with nearby schools including Krum Early Education Center, Dyer Elementary School, and Krum Middle School.
Ownership History
Date
Name
Owned For
Owner Type
Purchase Details
Closed on
May 29, 2020
Sold by
Stokes John Ruark and Stokes Courtney
Bought by
Tomblin Justin C
Current Estimated Value
Home Financials for this Owner
Home Financials are based on the most recent Mortgage that was taken out on this home.
Original Mortgage
$232,750
Outstanding Balance
$206,700
Interest Rate
3.3%
Mortgage Type
New Conventional
Estimated Equity
$146,797
Purchase Details
Closed on
Apr 19, 2018
Sold by
Stokes Ricky and Stokes Gladys
Bought by
Stokes John Ruark
Purchase Details
Closed on
May 3, 2016
Sold by
Linc Homes & Construction Llc
Bought by
Stokes Gladys and Stokes Ricky
Home Financials for this Owner
Home Financials are based on the most recent Mortgage that was taken out on this home.
Original Mortgage
$159,280
Interest Rate
3.71%
Mortgage Type
New Conventional
Purchase Details
Closed on
Oct 15, 2015
Sold by
Roberson Albert and Roberson Mary
Bought by
Linc Homes & Construction Llc
Create a Home Valuation Report for This Property
The Home Valuation Report is an in-depth analysis detailing your home's value as well as a comparison with similar homes in the area
Home Values in the Area
Average Home Value in this Area
Purchase History
| Date | Buyer | Sale Price | Title Company |
|---|---|---|---|
| Tomblin Justin C | -- | National Title | |
| Stokes John Ruark | -- | None Available | |
| Stokes Gladys | -- | Fidelity Natl Title Agency I | |
| Linc Homes & Construction Llc | $44,964 | None Available |
Source: Public Records
Mortgage History
| Date | Status | Borrower | Loan Amount |
|---|---|---|---|
| Open | Tomblin Justin C | $232,750 | |
| Previous Owner | Stokes Gladys | $159,280 |
Source: Public Records
Tax History Compared to Growth
Tax History
| Year | Tax Paid | Tax Assessment Tax Assessment Total Assessment is a certain percentage of the fair market value that is determined by local assessors to be the total taxable value of land and additions on the property. | Land | Improvement |
|---|---|---|---|---|
| 2025 | $2,469 | $248,332 | $77,253 | $171,079 |
| 2024 | $3,708 | $261,581 | $50,625 | $210,956 |
| 2023 | $2,445 | $259,295 | $50,625 | $208,670 |
| 2022 | $4,047 | $247,491 | $64,343 | $194,710 |
| 2021 | $3,533 | $224,992 | $54,048 | $170,944 |
| 2020 | $3,513 | $217,235 | $54,048 | $163,187 |
| 2019 | $3,916 | $221,813 | $54,048 | $167,765 |
| 2018 | $3,502 | $197,000 | $54,048 | $142,952 |
| 2017 | $3,524 | $197,048 | $54,048 | $143,000 |
| 2016 | $1,313 | $73,398 | $22,054 | $51,344 |
| 2015 | $1,183 | $71,370 | $22,054 | $49,316 |
| 2013 | -- | $61,744 | $22,054 | $39,690 |
Source: Public Records
Map
Nearby Homes
- 6124 High Meadows Dr
- 6691 Hawkeye Rd
- 6869 Borth Rd
- 7196 Hawkeye Rd
- 6713 Mustang Trail
- TBD Hawkeye Rd
- 4140 Fm 2450
- 124 Fm 2450
- 6501 Indian Trail
- . Fm 2450 & Indian Trail
- 8751 Kassandra Dr
- 8636 Kassandra Dr
- 8774 Kassandra Dr
- Tbd 5 3 Acres Gregg Rd
- 8167 Houston
- TBD 5.3 ACRES Gregg Rd
- 100 Turtle Dove
- 31 Rogers Cir
- 2 Finley Cir
- 198 Radecke Rd
- 10534 Hawkeye Rd
- 6246 Hawkeye Rd
- 6320 Coyote Ct
- 6365 Hawkeye Rd
- 6232 High Meadows Dr
- 6366 Coyote Ct
- 6228 High Meadows Dr
- 6224 High Meadows Dr
- 10614 Coyote Ct
- 6129 Hawkeye Rd
- 6129 Hawkeye Rd
- 6129 Hawkeye Rd
- 6399 Hawkeye Rd
- 6233 High Meadows Dr
- 6450 Coyote Ct
- 6229 High Meadows Dr
- 6100 Hawkeye Rd
- 6225 High Meadows Dr
- 6220 High Meadows Dr
- 6048 Hawkeye Rd