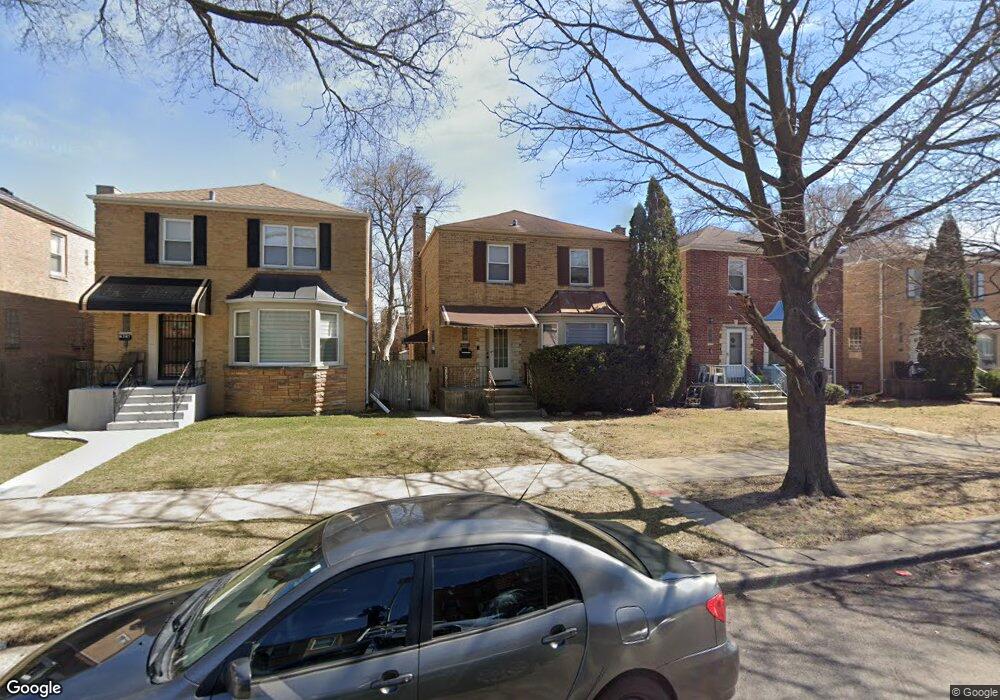
6245 N Sacramento Ave Chicago, IL 60659
West Ridge NeighborhoodEstimated Value: $468,000 - $521,108
9
Beds
3
Baths
1,751
Sq Ft
$286/Sq Ft
Est. Value
About This Home
This home is located at 6245 N Sacramento Ave, Chicago, IL 60659 and is currently estimated at $501,527, approximately $286 per square foot. 6245 N Sacramento Ave is a home located in Cook County with nearby schools including West Ridge Elementary School, Mather High School, and Yeshivas Tiferes Tzvi Academy.
Ownership History
Date
Name
Owned For
Owner Type
Purchase Details
Closed on
Nov 24, 2004
Sold by
Levin Martin S and Levin Lynn M
Bought by
Levin Martin S and Levin Lynn M
Current Estimated Value
Home Financials for this Owner
Home Financials are based on the most recent Mortgage that was taken out on this home.
Original Mortgage
$272,000
Outstanding Balance
$135,646
Interest Rate
5.77%
Mortgage Type
Unknown
Estimated Equity
$365,881
Purchase Details
Closed on
Nov 22, 2004
Sold by
Roth Steven and Roth Sara
Bought by
Levin Martin S and Levin Lynn M
Home Financials for this Owner
Home Financials are based on the most recent Mortgage that was taken out on this home.
Original Mortgage
$272,000
Outstanding Balance
$135,646
Interest Rate
5.77%
Mortgage Type
Unknown
Estimated Equity
$365,881
Create a Home Valuation Report for This Property
The Home Valuation Report is an in-depth analysis detailing your home's value as well as a comparison with similar homes in the area
Home Values in the Area
Average Home Value in this Area
Purchase History
| Date | Buyer | Sale Price | Title Company |
|---|---|---|---|
| Levin Martin S | -- | -- | |
| Levin Martin S | $340,000 | -- |
Source: Public Records
Mortgage History
| Date | Status | Borrower | Loan Amount |
|---|---|---|---|
| Open | Levin Martin S | $272,000 |
Source: Public Records
Tax History Compared to Growth
Tax History
| Year | Tax Paid | Tax Assessment Tax Assessment Total Assessment is a certain percentage of the fair market value that is determined by local assessors to be the total taxable value of land and additions on the property. | Land | Improvement |
|---|---|---|---|---|
| 2024 | $7,078 | $41,738 | $15,140 | $26,598 |
| 2023 | $6,878 | $36,860 | $12,276 | $24,584 |
| 2022 | $6,878 | $36,860 | $12,276 | $24,584 |
| 2021 | $6,743 | $36,860 | $12,276 | $24,584 |
| 2020 | $6,231 | $31,075 | $7,365 | $23,710 |
| 2019 | $6,326 | $34,916 | $7,365 | $27,551 |
| 2018 | $6,218 | $34,916 | $7,365 | $27,551 |
| 2017 | $6,262 | $32,464 | $6,547 | $25,917 |
| 2016 | $6,002 | $32,464 | $6,547 | $25,917 |
| 2015 | $5,468 | $32,464 | $6,547 | $25,917 |
| 2014 | $5,509 | $32,262 | $6,138 | $26,124 |
| 2013 | $5,389 | $32,262 | $6,138 | $26,124 |
Source: Public Records
Map
Nearby Homes
- 6212 N Sacramento Ave
- 6226 N Mozart St Unit 2N
- 6214 N Mozart St Unit 3E
- 6210 N Albany Ave
- 6235 N Mozart St
- 6400 N Sacramento Ave Unit 205
- 6310 N Troy St
- 6312 N Fairfield Ave Unit 3B
- 6040 N Troy St Unit 306
- 6308 N Kedzie Ave Unit 2W
- 6508 N Richmond St Unit 1D
- 6504 N Whipple St
- 6215 N Washtenaw Ave
- 6451 N California Ave Unit 2
- 6457 N California Ave Unit 3
- 6539 N Sacramento Ave
- 6215 N Talman Ave
- 6544 N Albany Ave
- 6307 N Talman Ave
- 5838 N Sacramento Ave
- 6247 N Sacramento Ave
- 6241 N Sacramento Ave
- 6251 N Sacramento Ave
- 6237 N Sacramento Ave
- 6233 N Sacramento Ave
- 2951 W Rosemont Ave Unit 2E
- 2951 W Rosemont Ave Unit 1E
- 2955 W Rosemont Ave Unit 2W
- 2955 W Rosemont Ave Unit 1W
- 6229 N Sacramento Ave
- 6244 N Richmond St
- 6240 N Richmond St
- 6236 N Richmond St Unit 1
- 6236 N Richmond St Unit 3
- 6236 N Richmond St
- 6250 N Richmond St
- 6227 N Sacramento Ave
- 6234 N Richmond St
- 6234 N Richmond St Unit 1
- 6234 N Richmond St Unit 3