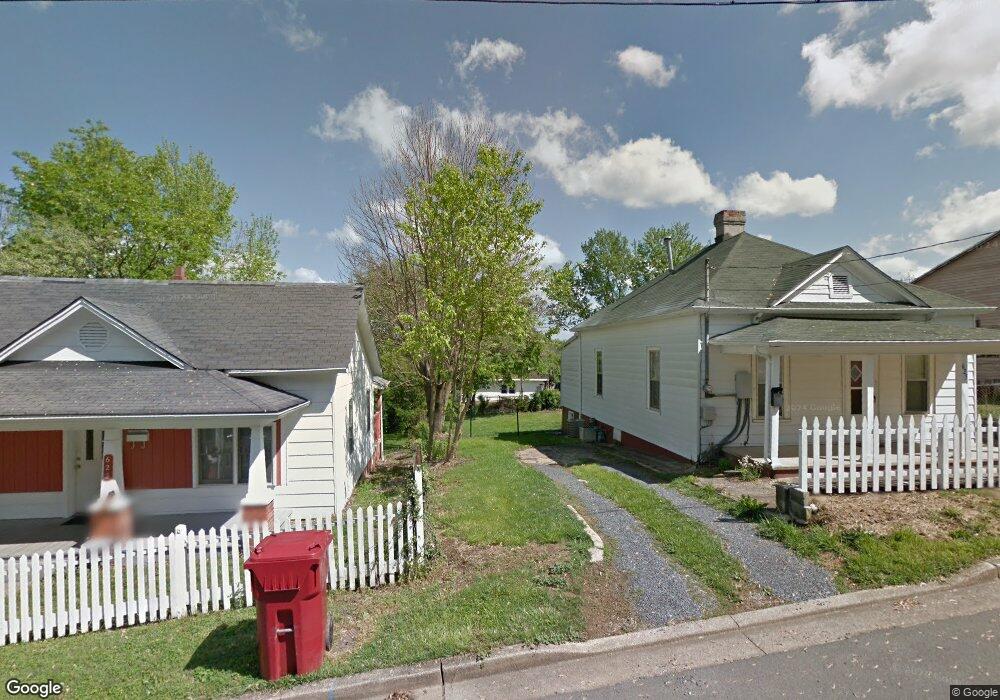
626 E Maple St Johnson City, TN 37601
Estimated Value: $152,000 - $244,000
--
Bed
1
Bath
2,280
Sq Ft
$89/Sq Ft
Est. Value
About This Home
This home is located at 626 E Maple St, Johnson City, TN 37601 and is currently estimated at $201,934, approximately $88 per square foot. 626 E Maple St is a home located in Washington County with nearby schools including Mountain View Elementary School, Liberty Bell Middle School, and Indian Trail Middle School.
Ownership History
Date
Name
Owned For
Owner Type
Purchase Details
Closed on
Apr 21, 2011
Sold by
First Bank And Trust Co Cu
Bought by
Scott Dwight and Scott Shirley
Current Estimated Value
Home Financials for this Owner
Home Financials are based on the most recent Mortgage that was taken out on this home.
Original Mortgage
$25,000
Outstanding Balance
$17,256
Interest Rate
4.81%
Mortgage Type
Commercial
Estimated Equity
$184,678
Purchase Details
Closed on
Apr 9, 2011
Sold by
Roark Ricky Thomas
Bought by
First Bank And Trust Co
Home Financials for this Owner
Home Financials are based on the most recent Mortgage that was taken out on this home.
Original Mortgage
$25,000
Outstanding Balance
$17,256
Interest Rate
4.81%
Mortgage Type
Commercial
Estimated Equity
$184,678
Purchase Details
Closed on
Sep 6, 2006
Sold by
Ted Rose
Bought by
Thomas Roark Ricky
Purchase Details
Closed on
Sep 5, 2006
Sold by
Des Enterprises Inc
Bought by
Roark Ricky Thomas
Purchase Details
Closed on
Aug 31, 1998
Bought by
Des Enterprises Inc
Create a Home Valuation Report for This Property
The Home Valuation Report is an in-depth analysis detailing your home's value as well as a comparison with similar homes in the area
Home Values in the Area
Average Home Value in this Area
Purchase History
| Date | Buyer | Sale Price | Title Company |
|---|---|---|---|
| Scott Dwight | $25,000 | -- | |
| First Bank And Trust Co | -- | -- | |
| Thomas Roark Ricky | $50,000 | -- | |
| Ted Rose | $50,000 | -- | |
| Roark Ricky Thomas | $50,000 | -- | |
| Des Enterprises Inc | $40,000 | -- |
Source: Public Records
Mortgage History
| Date | Status | Borrower | Loan Amount |
|---|---|---|---|
| Open | Scott Dwight | $25,000 |
Source: Public Records
Tax History Compared to Growth
Tax History
| Year | Tax Paid | Tax Assessment Tax Assessment Total Assessment is a certain percentage of the fair market value that is determined by local assessors to be the total taxable value of land and additions on the property. | Land | Improvement |
|---|---|---|---|---|
| 2024 | $858 | $50,175 | $4,450 | $45,725 |
| 2023 | $499 | $23,225 | $0 | $0 |
| 2022 | $499 | $23,225 | $3,900 | $19,325 |
| 2021 | $901 | $23,225 | $3,900 | $19,325 |
| 2020 | $896 | $23,225 | $3,900 | $19,325 |
| 2019 | $392 | $23,225 | $3,900 | $19,325 |
| 2018 | $703 | $16,475 | $2,000 | $14,475 |
| 2017 | $703 | $16,475 | $2,000 | $14,475 |
| 2016 | $700 | $16,475 | $2,000 | $14,475 |
| 2015 | $634 | $16,475 | $2,000 | $14,475 |
| 2014 | $566 | $15,725 | $2,000 | $13,725 |
Source: Public Records
Map
Nearby Homes
- 908 Afton St
- 900 Grover St
- 805 E Maple St
- 203 E Locust St
- 102 W Locust St
- 102 E Walnut St
- 1009 E Main St
- 112 W Chestnut St
- 505 Orleans St
- 1007 Spring St
- 71 Glaze Farm Way
- Tbd Orleans St
- 1704 Orlando Dr
- 414 S Roan St Unit 202
- 106 Water St
- 116 Tipton St Unit 209
- 322 Preservation Cir
- 200 E Main St Unit 5
- 300 Peach Blossom Ct
- 403 W Poplar St