626 Milford Ct Abingdon, MD 21009
Estimated Value: $270,859 - $299,000
--
Bed
4
Baths
1,240
Sq Ft
$230/Sq Ft
Est. Value
About This Home
This home is located at 626 Milford Ct, Abingdon, MD 21009 and is currently estimated at $284,715, approximately $229 per square foot. 626 Milford Ct is a home located in Harford County with nearby schools including Abingdon Elementary School, Edgewood Middle School, and Edgewood High School.
Ownership History
Date
Name
Owned For
Owner Type
Purchase Details
Closed on
Aug 8, 2006
Sold by
Martz and Rew
Bought by
Philbert Danian H
Current Estimated Value
Home Financials for this Owner
Home Financials are based on the most recent Mortgage that was taken out on this home.
Original Mortgage
$204,800
Outstanding Balance
$122,356
Interest Rate
6.67%
Mortgage Type
VA
Estimated Equity
$162,359
Purchase Details
Closed on
Jul 11, 2006
Sold by
Martz and Rew
Bought by
Philbert Danian H
Home Financials for this Owner
Home Financials are based on the most recent Mortgage that was taken out on this home.
Original Mortgage
$204,800
Outstanding Balance
$122,356
Interest Rate
6.67%
Mortgage Type
VA
Estimated Equity
$162,359
Purchase Details
Closed on
May 16, 2005
Sold by
Bishop James W
Bought by
Martz Andrew
Home Financials for this Owner
Home Financials are based on the most recent Mortgage that was taken out on this home.
Original Mortgage
$18,000
Interest Rate
6.05%
Mortgage Type
Credit Line Revolving
Purchase Details
Closed on
Jun 4, 1997
Sold by
Murk Jeffrey R
Bought by
Bishop James W and Bishop Catherine L
Create a Home Valuation Report for This Property
The Home Valuation Report is an in-depth analysis detailing your home's value as well as a comparison with similar homes in the area
Home Values in the Area
Average Home Value in this Area
Purchase History
| Date | Buyer | Sale Price | Title Company |
|---|---|---|---|
| Philbert Danian H | $200,000 | -- | |
| Philbert Danian H | $200,000 | -- | |
| Martz Andrew | $180,000 | -- | |
| Bishop James W | $87,880 | -- |
Source: Public Records
Mortgage History
| Date | Status | Borrower | Loan Amount |
|---|---|---|---|
| Open | Philbert Danian H | $204,800 | |
| Closed | Philbert Danian H | $204,800 | |
| Previous Owner | Martz Andrew | $18,000 | |
| Closed | Bishop James W | -- |
Source: Public Records
Tax History Compared to Growth
Tax History
| Year | Tax Paid | Tax Assessment Tax Assessment Total Assessment is a certain percentage of the fair market value that is determined by local assessors to be the total taxable value of land and additions on the property. | Land | Improvement |
|---|---|---|---|---|
| 2025 | $2,113 | $206,533 | $0 | $0 |
| 2024 | $2,113 | $193,867 | $0 | $0 |
| 2023 | $1,975 | $181,200 | $55,000 | $126,200 |
| 2022 | $1,904 | $174,733 | $0 | $0 |
| 2021 | $1,867 | $168,267 | $0 | $0 |
| 2020 | $1,867 | $161,800 | $55,000 | $106,800 |
| 2019 | $1,867 | $161,800 | $55,000 | $106,800 |
| 2018 | $1,850 | $161,800 | $55,000 | $106,800 |
| 2017 | $1,872 | $163,700 | $0 | $0 |
| 2016 | -- | $163,700 | $0 | $0 |
| 2015 | $2,268 | $163,700 | $0 | $0 |
| 2014 | $2,268 | $165,500 | $0 | $0 |
Source: Public Records
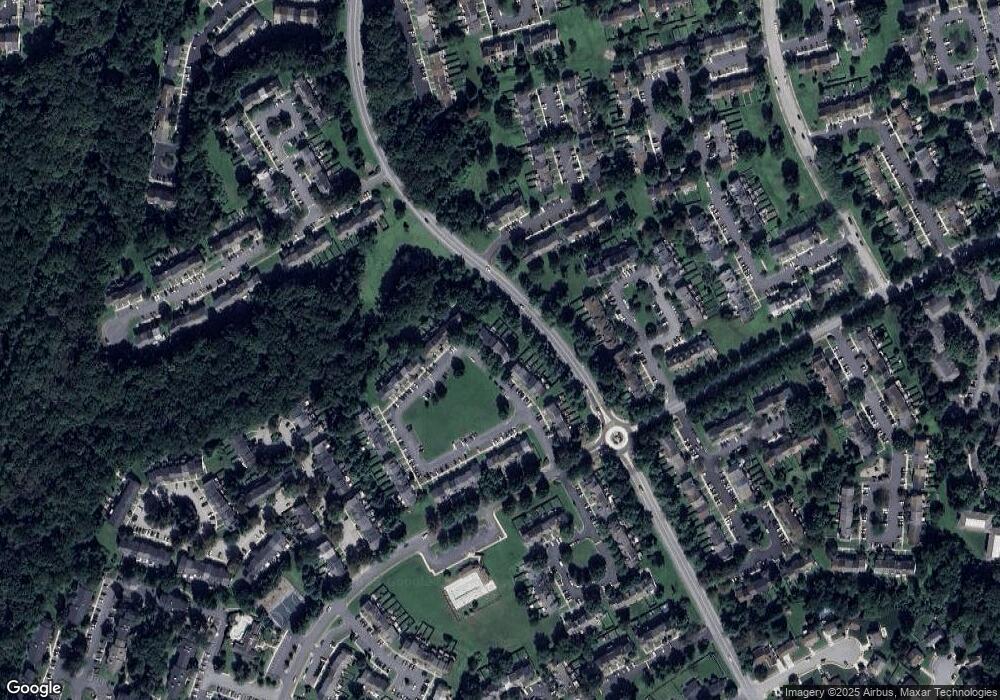
Map
Nearby Homes
- 627 Stone Mill Ct
- 310 Talbot Ct
- 3363 Garrison Cir
- 625 N Branch Ct
- 339 Overlea Place
- 634 Nanticoke Ct
- 423 Oakton Way
- 322 Overlea Place
- 3329 Betterton Cir
- 329 Sunray Ct
- 322 Delmar Ct
- 3500 Thomas Pointe Ct Unit 2B
- 203 Star Pointe Ct Unit 2C
- 203 Star Pointe Ct Unit 3C
- 497 Ashton Ln
- 201 Star Pointe Ct Unit 1A
- 201 Windmille Pointe Ct Unit 2C
- 3506 Back Pointe Ct Unit 3D
- 3110 Tipton Way
- 384 Foreland Garth