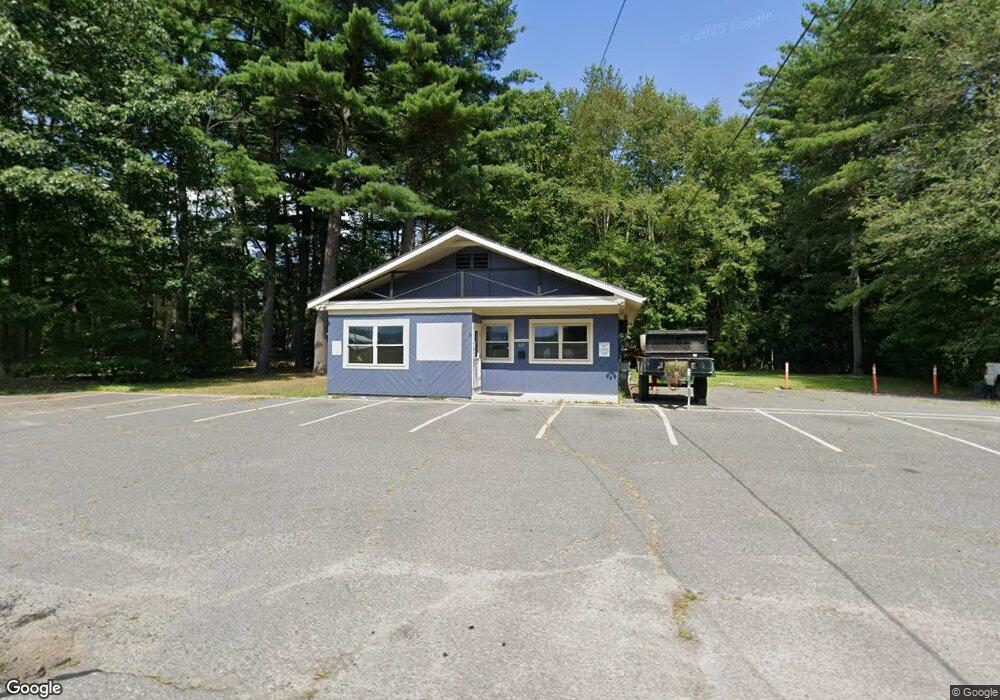
627 E River St Orange, MA 01364
Estimated Value: $125,385
--
Bed
2
Baths
900
Sq Ft
$139/Sq Ft
Est. Value
About This Home
This home is located at 627 E River St, Orange, MA 01364 and is currently estimated at $125,385, approximately $139 per square foot. 627 E River St is a home located in Franklin County with nearby schools including Fisher Hill and Ralph C Mahar Regional School.
Ownership History
Date
Name
Owned For
Owner Type
Purchase Details
Closed on
Jan 11, 2008
Sold by
Brewer Paul L and Prue Sharon L
Bought by
Prue Sharon L
Current Estimated Value
Home Financials for this Owner
Home Financials are based on the most recent Mortgage that was taken out on this home.
Original Mortgage
$38,000
Outstanding Balance
$23,831
Interest Rate
6.21%
Mortgage Type
Commercial
Estimated Equity
$101,554
Purchase Details
Closed on
Mar 13, 2006
Sold by
Miner Amy E and Pearl Dwight J
Bought by
Brewer Paul L and Prue Sharon L
Purchase Details
Closed on
Sep 28, 2004
Sold by
Amys White Restaurant
Bought by
Pearl Dwight J and Miner Garth J
Purchase Details
Closed on
Sep 7, 2004
Sold by
Bouchard Norman J
Bought by
Amys White Cloud Rest
Purchase Details
Closed on
Feb 12, 2001
Sold by
Atkins Irene R
Bought by
Bouchard Norman J
Create a Home Valuation Report for This Property
The Home Valuation Report is an in-depth analysis detailing your home's value as well as a comparison with similar homes in the area
Home Values in the Area
Average Home Value in this Area
Purchase History
| Date | Buyer | Sale Price | Title Company |
|---|---|---|---|
| Prue Sharon L | -- | -- | |
| Prue Sharon L | -- | -- | |
| Prue Sharon L | -- | -- | |
| Brewer Paul L | $200,000 | -- | |
| Brewer Paul L | $200,000 | -- | |
| Pearl Dwight J | -- | -- | |
| Pearl Dwight J | -- | -- | |
| Amys White Cloud Rest | $150,000 | -- | |
| Amys White Cloud Rest | $150,000 | -- | |
| Bouchard Norman J | $100,000 | -- | |
| Bouchard Norman J | $100,000 | -- |
Source: Public Records
Mortgage History
| Date | Status | Borrower | Loan Amount |
|---|---|---|---|
| Open | Prue Sharon L | $38,000 | |
| Closed | Bouchard Norman J | $38,000 |
Source: Public Records
Tax History Compared to Growth
Tax History
| Year | Tax Paid | Tax Assessment Tax Assessment Total Assessment is a certain percentage of the fair market value that is determined by local assessors to be the total taxable value of land and additions on the property. | Land | Improvement |
|---|---|---|---|---|
| 2025 | $25 | $154,000 | $52,300 | $101,700 |
| 2024 | $2,647 | $151,800 | $52,300 | $99,500 |
| 2023 | $2,498 | $139,100 | $52,300 | $86,800 |
| 2022 | $4,120 | $215,500 | $52,400 | $163,100 |
| 2021 | $4,128 | $205,900 | $82,300 | $123,600 |
| 2020 | $5,176 | $198,400 | $79,000 | $119,400 |
| 2019 | $4,065 | $180,500 | $70,700 | $109,800 |
| 2018 | $3,853 | $175,600 | $67,500 | $108,100 |
| 2017 | $3,741 | $176,200 | $67,500 | $108,700 |
| 2016 | $2,934 | $135,200 | $52,000 | $83,200 |
| 2015 | $3,545 | $170,700 | $52,000 | $118,700 |
| 2014 | $3,376 | $171,000 | $52,000 | $119,000 |
Source: Public Records
Map
Nearby Homes