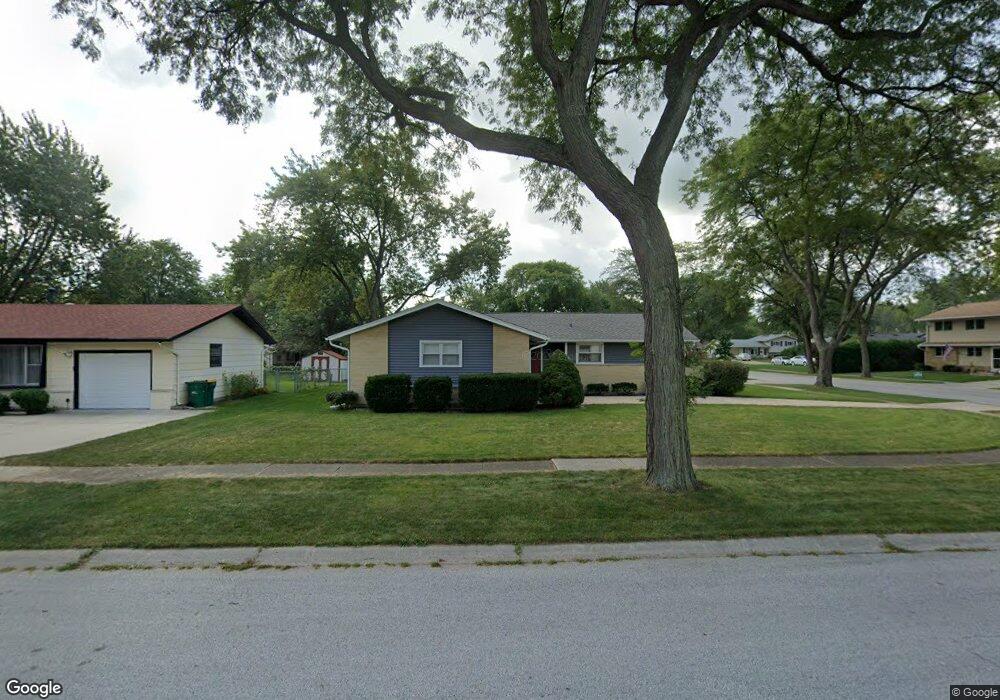
629 Ironwood Dr Elk Grove Village, IL 60007
Elk Grove Village East NeighborhoodEstimated Value: $364,000 - $383,461
3
Beds
2
Baths
1,564
Sq Ft
$239/Sq Ft
Est. Value
About This Home
This home is located at 629 Ironwood Dr, Elk Grove Village, IL 60007 and is currently estimated at $373,365, approximately $238 per square foot. 629 Ironwood Dr is a home located in Cook County with nearby schools including Rupley Elementary School, Grove Jr High School, and Elk Grove High School.
Ownership History
Date
Name
Owned For
Owner Type
Purchase Details
Closed on
Mar 4, 2021
Sold by
Lindahl Bradley D and Lindahl Sarah
Bought by
Lindahl Bradley D
Current Estimated Value
Home Financials for this Owner
Home Financials are based on the most recent Mortgage that was taken out on this home.
Original Mortgage
$179,500
Outstanding Balance
$148,069
Interest Rate
3.05%
Mortgage Type
New Conventional
Estimated Equity
$225,297
Purchase Details
Closed on
Jan 29, 2016
Sold by
Jano Michael E and Jano Lana
Bought by
Lindahl Bradley D
Home Financials for this Owner
Home Financials are based on the most recent Mortgage that was taken out on this home.
Original Mortgage
$196,175
Interest Rate
4%
Mortgage Type
New Conventional
Purchase Details
Closed on
May 6, 2008
Sold by
Chicago Title Land Trust Co
Bought by
Jano Michael E and Jano Lana
Home Financials for this Owner
Home Financials are based on the most recent Mortgage that was taken out on this home.
Original Mortgage
$138,500
Interest Rate
5.93%
Mortgage Type
Unknown
Create a Home Valuation Report for This Property
The Home Valuation Report is an in-depth analysis detailing your home's value as well as a comparison with similar homes in the area
Home Values in the Area
Average Home Value in this Area
Purchase History
| Date | Buyer | Sale Price | Title Company |
|---|---|---|---|
| Lindahl Bradley D | -- | Proper Title | |
| Lindahl Bradley D | $206,500 | American Natl Title Svcs Inc | |
| Jano Michael E | $135,000 | Chicago Title Land Trust Co |
Source: Public Records
Mortgage History
| Date | Status | Borrower | Loan Amount |
|---|---|---|---|
| Open | Lindahl Bradley D | $179,500 | |
| Closed | Lindahl Bradley D | $196,175 | |
| Previous Owner | Jano Michael E | $138,500 |
Source: Public Records
Tax History Compared to Growth
Tax History
| Year | Tax Paid | Tax Assessment Tax Assessment Total Assessment is a certain percentage of the fair market value that is determined by local assessors to be the total taxable value of land and additions on the property. | Land | Improvement |
|---|---|---|---|---|
| 2024 | $6,268 | $28,000 | $8,194 | $19,806 |
| 2023 | $6,005 | $28,000 | $8,194 | $19,806 |
| 2022 | $6,005 | $28,000 | $8,194 | $19,806 |
| 2021 | $5,416 | $22,841 | $5,121 | $17,720 |
| 2020 | $6,872 | $28,802 | $5,121 | $23,681 |
| 2019 | $6,956 | $32,003 | $5,121 | $26,882 |
| 2018 | $5,526 | $23,579 | $4,608 | $18,971 |
| 2017 | $6,422 | $23,579 | $4,608 | $18,971 |
| 2016 | $5,999 | $23,579 | $4,608 | $18,971 |
| 2015 | $6,178 | $23,071 | $3,840 | $19,231 |
| 2014 | $6,093 | $23,071 | $3,840 | $19,231 |
| 2013 | $5,955 | $23,071 | $3,840 | $19,231 |
Source: Public Records
Map
Nearby Homes
- 105 Crest Ave
- 522 Edgewood Ln
- 510 Oakton St
- 539 Ridgewood Rd
- 509 Shadywood Ln
- 532 Landmeier Rd
- 1520 Grove Terrace
- 630 Perrie Dr Unit 104
- 50 Ridgewood Rd
- 301 Forest View Ave
- 301 S Arlington Heights Rd
- 550 Ridge Ave
- 865 Love St
- 851 Crest Ave
- 836 Bonita Ave
- 2831 S Embers Ln Unit 352831
- 679 W Elk Grove Blvd
- 685 Maple Ct
- 568 Cedar Ln
- 943 Maple Ln
- 631 Ironwood Dr
- 622 Willow Ln
- 626 Willow Ln
- 633 Ironwood Dr
- 620 Ironwood Dr
- 624 Ironwood Dr
- 630 Ironwood Dr
- 632 Ironwood Dr
- 630 Willow Ln
- 618 Ironwood Dr
- 626 Ironwood Dr
- 635 Ironwood Dr
- 634 Ironwood Dr
- 634 Willow Ln
- 123 Wildwood Rd
- 127 Wildwood Rd
- 119 Wildwood Rd
- 627 Oakton St
- 623 Oakton St
- 627 Willow Ln