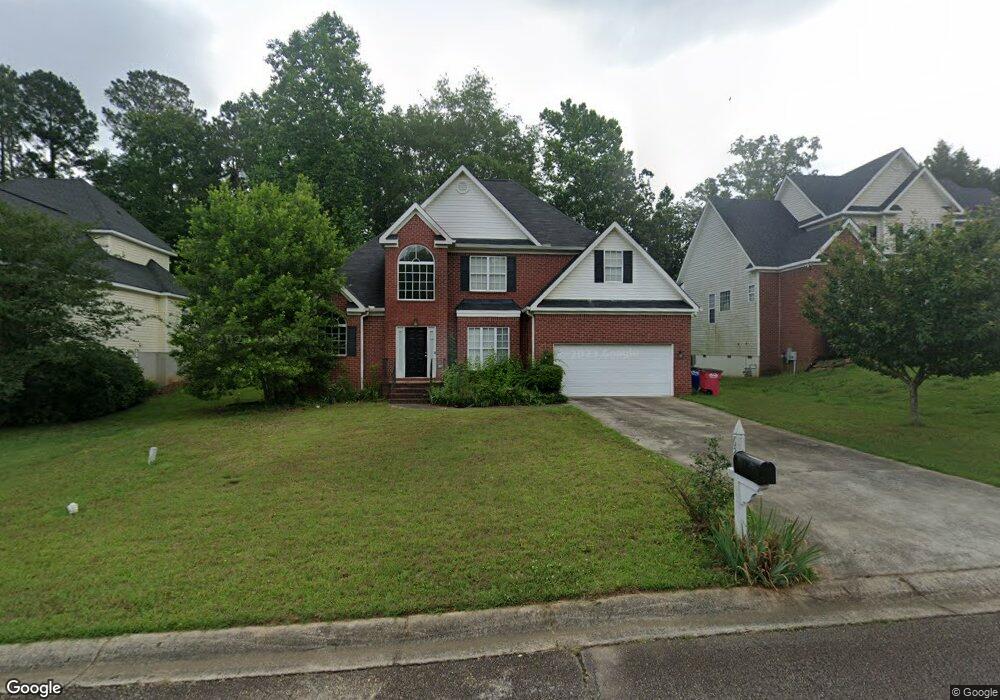
629 Millrun Ct Macon, GA 31210
Estimated Value: $285,000 - $407,000
3
Beds
3
Baths
2,110
Sq Ft
$154/Sq Ft
Est. Value
About This Home
This home is located at 629 Millrun Ct, Macon, GA 31210 and is currently estimated at $325,589, approximately $154 per square foot. 629 Millrun Ct is a home located in Bibb County with nearby schools including Springdale Elementary School, Howard Middle School, and Howard High School.
Ownership History
Date
Name
Owned For
Owner Type
Purchase Details
Closed on
Mar 18, 2014
Sold by
Alexander Adam C and Alexander Elizabeth A
Bought by
American International Relocation Soluti
Current Estimated Value
Purchase Details
Closed on
Aug 5, 2011
Sold by
Flores Omar
Bought by
Chien Li Chen
Purchase Details
Closed on
Jul 28, 2006
Sold by
Flores Linda
Bought by
Flores Omar
Purchase Details
Closed on
Feb 28, 2005
Sold by
Kittur Chandra K M Dinesh and Kittur Sannamagegowda Nandini
Bought by
Flores Omar and Flores Linda
Home Financials for this Owner
Home Financials are based on the most recent Mortgage that was taken out on this home.
Original Mortgage
$38,800
Interest Rate
5.61%
Mortgage Type
Credit Line Revolving
Purchase Details
Closed on
Aug 3, 2001
Bought by
Flores Omar
Create a Home Valuation Report for This Property
The Home Valuation Report is an in-depth analysis detailing your home's value as well as a comparison with similar homes in the area
Home Values in the Area
Average Home Value in this Area
Purchase History
| Date | Buyer | Sale Price | Title Company |
|---|---|---|---|
| American International Relocation Soluti | $165,000 | None Available | |
| Chien Li Chen | $190,000 | None Available | |
| Flores Omar | -- | None Available | |
| Flores Omar | $194,000 | None Available | |
| Flores Omar | $181,500 | -- |
Source: Public Records
Mortgage History
| Date | Status | Borrower | Loan Amount |
|---|---|---|---|
| Previous Owner | Flores Omar | $38,800 |
Source: Public Records
Tax History Compared to Growth
Tax History
| Year | Tax Paid | Tax Assessment Tax Assessment Total Assessment is a certain percentage of the fair market value that is determined by local assessors to be the total taxable value of land and additions on the property. | Land | Improvement |
|---|---|---|---|---|
| 2025 | $2,562 | $111,236 | $12,000 | $99,236 |
| 2024 | $2,457 | $103,740 | $12,000 | $91,740 |
| 2023 | $2,000 | $103,740 | $12,000 | $91,740 |
| 2022 | $3,072 | $95,731 | $10,800 | $84,931 |
| 2021 | $2,805 | $80,814 | $10,000 | $70,814 |
| 2020 | $2,592 | $73,755 | $10,000 | $63,755 |
| 2019 | $2,613 | $73,755 | $10,000 | $63,755 |
| 2018 | $4,182 | $73,755 | $10,000 | $63,755 |
| 2017 | $2,369 | $70,226 | $10,000 | $60,226 |
| 2016 | $2,065 | $66,696 | $10,000 | $56,696 |
| 2015 | $2,910 | $66,407 | $10,000 | $56,407 |
| 2014 | $3,087 | $69,933 | $10,000 | $59,933 |
Source: Public Records
Map
Nearby Homes
- 627 Millrun Ct
- 627 Millrun Ct Unit 8
- 631 Millrun Ct
- 0 Millrun Ct Unit 7120276
- 0 Millrun Ct Unit 8726640
- 529 Edgefield Way
- 529 Edgefield Way Unit 349
- 531 Edgefield Way
- 625 Millrun Ct
- 625 Millrun Ct Unit 9
- 527 Edgefield Way
- 633 Millrun Ct
- 628 Millrun Ct
- 533 Edgefield Way
- 525 Edgefield Way
- 626 Millrun Ct
- 623 Millrun Ct
- 172 Brookefield Dr
- 535 Edgefield Way
- 634 Millrun Ct