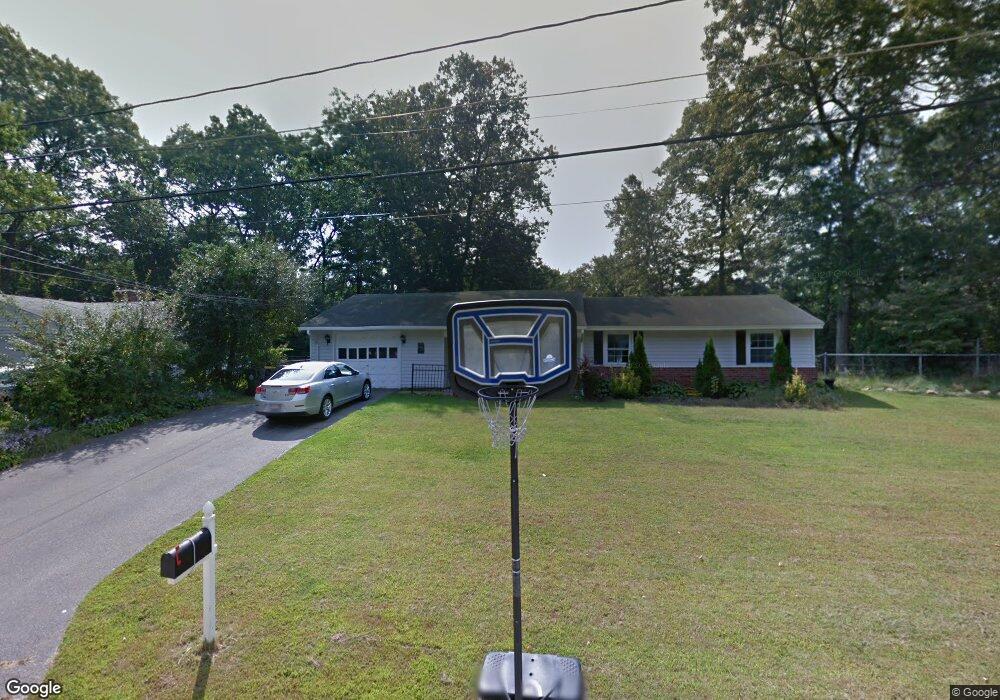
63 Clarence Rd Bellingham, MA 02019
Estimated Value: $459,260 - $518,000
3
Beds
2
Baths
1,428
Sq Ft
$338/Sq Ft
Est. Value
About This Home
This home is located at 63 Clarence Rd, Bellingham, MA 02019 and is currently estimated at $482,065, approximately $337 per square foot. 63 Clarence Rd is a home located in Norfolk County with nearby schools including Stall Brook Elementary School, Bellingham High School, and Bethany Christian Academy.
Ownership History
Date
Name
Owned For
Owner Type
Purchase Details
Closed on
May 27, 2005
Sold by
Bowen Eleanor M and Donohue Eleanor M
Bought by
Derubeis Jennifer and Derubeis Mark
Current Estimated Value
Home Financials for this Owner
Home Financials are based on the most recent Mortgage that was taken out on this home.
Original Mortgage
$240,000
Outstanding Balance
$126,743
Interest Rate
5.94%
Mortgage Type
Purchase Money Mortgage
Estimated Equity
$355,322
Create a Home Valuation Report for This Property
The Home Valuation Report is an in-depth analysis detailing your home's value as well as a comparison with similar homes in the area
Home Values in the Area
Average Home Value in this Area
Purchase History
| Date | Buyer | Sale Price | Title Company |
|---|---|---|---|
| Derubeis Jennifer | $300,000 | -- |
Source: Public Records
Mortgage History
| Date | Status | Borrower | Loan Amount |
|---|---|---|---|
| Open | Derubeis Jennifer | $240,000 | |
| Closed | Derubeis Jennifer | $29,900 |
Source: Public Records
Tax History Compared to Growth
Tax History
| Year | Tax Paid | Tax Assessment Tax Assessment Total Assessment is a certain percentage of the fair market value that is determined by local assessors to be the total taxable value of land and additions on the property. | Land | Improvement |
|---|---|---|---|---|
| 2025 | $4,563 | $363,300 | $165,400 | $197,900 |
| 2024 | $4,349 | $338,200 | $151,000 | $187,200 |
| 2023 | $4,193 | $321,300 | $143,800 | $177,500 |
| 2022 | $4,062 | $288,500 | $119,900 | $168,600 |
| 2021 | $3,969 | $275,400 | $119,900 | $155,500 |
| 2020 | $3,773 | $265,300 | $119,900 | $145,400 |
| 2019 | $3,699 | $260,300 | $119,900 | $140,400 |
| 2018 | $3,466 | $240,500 | $115,300 | $125,200 |
| 2017 | $3,384 | $236,000 | $115,300 | $120,700 |
| 2016 | $3,258 | $228,000 | $113,400 | $114,600 |
| 2015 | $3,125 | $219,300 | $109,000 | $110,300 |
| 2014 | $3,140 | $214,200 | $106,500 | $107,700 |
Source: Public Records
Map
Nearby Homes