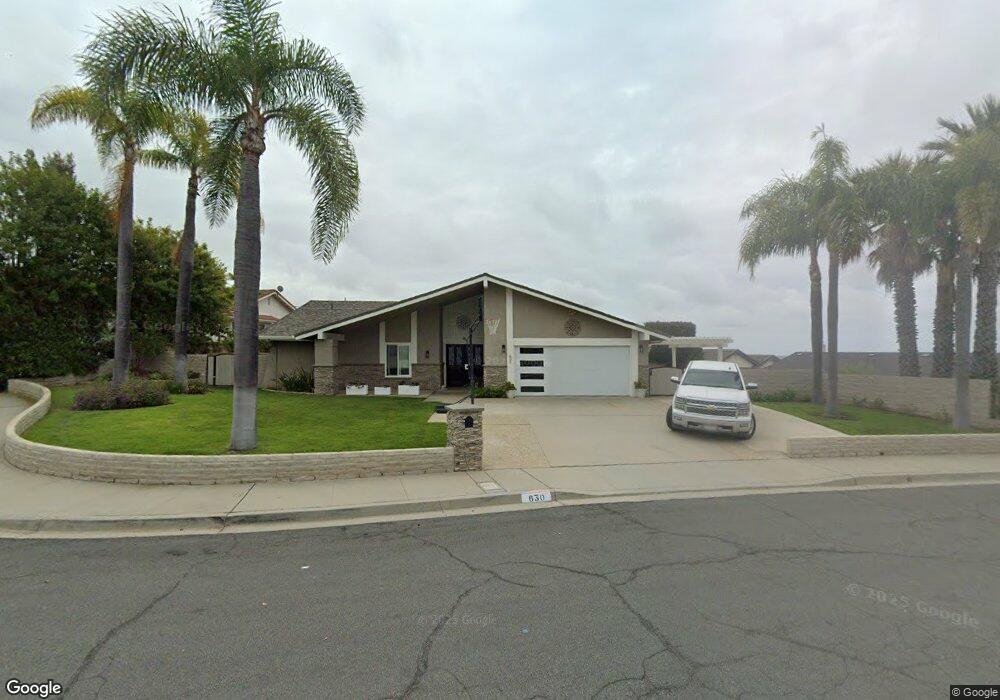
630 Creekmont Ct Ventura, CA 93003
Poinsettia NeighborhoodEstimated Value: $1,182,959 - $1,492,000
4
Beds
2
Baths
1,928
Sq Ft
$720/Sq Ft
Est. Value
About This Home
This home is located at 630 Creekmont Ct, Ventura, CA 93003 and is currently estimated at $1,387,490, approximately $719 per square foot. 630 Creekmont Ct is a home located in Ventura County with nearby schools including Poinsettia Elementary School, Cabrillo Middle School, and Ventura High School.
Ownership History
Date
Name
Owned For
Owner Type
Purchase Details
Closed on
Apr 18, 2003
Sold by
Tepper Arline R
Bought by
Davidson John L and Davidson Karen D
Current Estimated Value
Home Financials for this Owner
Home Financials are based on the most recent Mortgage that was taken out on this home.
Original Mortgage
$508,000
Interest Rate
5.37%
Mortgage Type
Purchase Money Mortgage
Purchase Details
Closed on
Dec 12, 1996
Sold by
Nami Mike M and Nami Lisa G
Bought by
Tepper Arline R
Home Financials for this Owner
Home Financials are based on the most recent Mortgage that was taken out on this home.
Original Mortgage
$228,750
Interest Rate
7.66%
Purchase Details
Closed on
Dec 18, 1995
Sold by
Perlmutter David T and Perlmutter Claudia
Bought by
Nami Mike M and Nami Lisa G
Home Financials for this Owner
Home Financials are based on the most recent Mortgage that was taken out on this home.
Original Mortgage
$203,150
Interest Rate
6.76%
Create a Home Valuation Report for This Property
The Home Valuation Report is an in-depth analysis detailing your home's value as well as a comparison with similar homes in the area
Home Values in the Area
Average Home Value in this Area
Purchase History
| Date | Buyer | Sale Price | Title Company |
|---|---|---|---|
| Davidson John L | $635,000 | Lawyers Title Company | |
| Tepper Arline R | $305,000 | Gateway Title Company | |
| Nami Mike M | $290,000 | First American Title Ins Co |
Source: Public Records
Mortgage History
| Date | Status | Borrower | Loan Amount |
|---|---|---|---|
| Previous Owner | Davidson John L | $508,000 | |
| Previous Owner | Tepper Arline R | $228,750 | |
| Previous Owner | Nami Mike M | $203,150 |
Source: Public Records
Tax History Compared to Growth
Tax History
| Year | Tax Paid | Tax Assessment Tax Assessment Total Assessment is a certain percentage of the fair market value that is determined by local assessors to be the total taxable value of land and additions on the property. | Land | Improvement |
|---|---|---|---|---|
| 2025 | $9,833 | $919,667 | $459,834 | $459,833 |
| 2024 | $9,833 | $901,635 | $450,818 | $450,817 |
| 2023 | $9,722 | $883,956 | $441,978 | $441,978 |
| 2022 | $9,033 | $866,624 | $433,312 | $433,312 |
| 2021 | $8,877 | $849,632 | $424,816 | $424,816 |
| 2020 | $8,795 | $840,922 | $420,461 | $420,461 |
| 2019 | $8,634 | $824,434 | $412,217 | $412,217 |
| 2018 | $7,859 | $747,649 | $404,135 | $343,514 |
| 2017 | $8,331 | $792,422 | $396,211 | $396,211 |
| 2016 | $8,184 | $776,886 | $388,443 | $388,443 |
| 2015 | $8,052 | $765,218 | $382,609 | $382,609 |
| 2014 | $7,788 | $736,000 | $368,000 | $368,000 |
Source: Public Records
Map
Nearby Homes
- 801 High Point Dr
- 691 Via Ondulando
- 887 Via Ondulando
- 872 Via Arroyo
- 259 Via Pasito
- 961 Colina Vista
- 708 Skyview Terrace
- 978 Colina Vista
- 1018 Via Arroyo
- 7017 Sonora Ct
- 234 Roosevelt Ave
- 7405 Loma Vista Rd
- 7835 Marin Ln
- 1161 Via Arroyo
- 6153 Cobblestone Dr
- 6174 Cobblestone Dr
- 146 Donner Ave
- 159 Donner Ave
- 91 Mount Whitney Ct
- 143 Taft Ave
- 642 Creekmont Ct
- 618 Monte Vista Ave
- 7015 El Malabar Dr
- 666 Creekmont Ct
- 637 Creekmont Ct
- 7033 El Malabar Dr
- 654 Creekmont Ct
- 621 Creekmont Ct
- 678 Creekmont Ct
- 7051 El Malabar Dr
- 685 Creekmont Ct
- 609 Monte Vista Ave
- 627 Monte Vista Ave
- 578 La Fonda Dr
- 710 Monte Vista Ave
- 619 High Point Dr
- 7085 El Malabar Dr
- 663 Monte Vista Ave
- 637 High Point Dr
- 690 Creekmont Ct