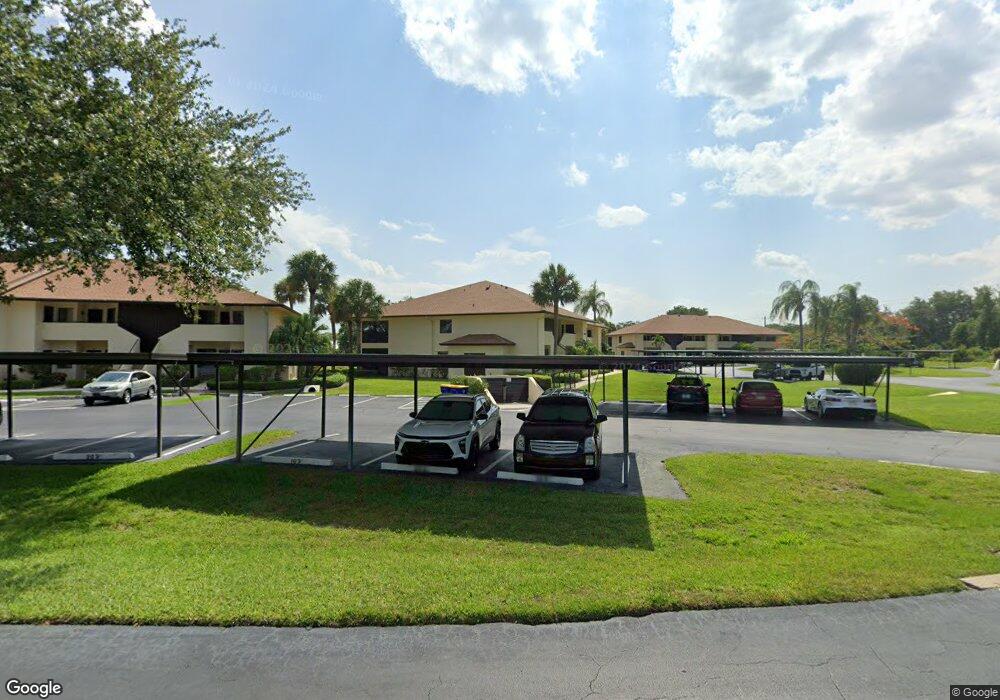
6303 SE Wmsburg Dr Unit 201 Hobe Sound, FL 33455
Estimated Value: $274,000 - $292,000
2
Beds
2
Baths
1,224
Sq Ft
$232/Sq Ft
Est. Value
About This Home
This home is located at 6303 SE Wmsburg Dr Unit 201, Hobe Sound, FL 33455 and is currently estimated at $283,964, approximately $231 per square foot. 6303 SE Wmsburg Dr Unit 201 is a home located in Martin County with nearby schools including Sea Wind Elementary School, Murray Middle School, and South Fork High School.
Ownership History
Date
Name
Owned For
Owner Type
Purchase Details
Closed on
Apr 16, 2021
Sold by
Tewey John F and Mullally Laura
Bought by
Hatten Michael M and Nichols Lynda M
Current Estimated Value
Purchase Details
Closed on
Feb 24, 2011
Sold by
Cragen Patricia L and Cragen Donald E
Bought by
Tewey John F and Mullally Laura
Home Financials for this Owner
Home Financials are based on the most recent Mortgage that was taken out on this home.
Original Mortgage
$68,625
Interest Rate
4.76%
Mortgage Type
New Conventional
Purchase Details
Closed on
Apr 17, 2001
Sold by
Cragen Patricia L
Bought by
Tewey John F and Mullally Laura
Purchase Details
Closed on
Mar 30, 2000
Sold by
Muffly Robert E and Muffly Ann L
Bought by
Cragen Patricia L
Purchase Details
Closed on
Sep 22, 1993
Sold by
Elmac Dev Inc
Bought by
Bentley Edwin G and Bentley Linda D
Create a Home Valuation Report for This Property
The Home Valuation Report is an in-depth analysis detailing your home's value as well as a comparison with similar homes in the area
Home Values in the Area
Average Home Value in this Area
Purchase History
| Date | Buyer | Sale Price | Title Company |
|---|---|---|---|
| Hatten Michael M | $180,000 | Signature Title Fl Partners | |
| Tewey John F | $91,500 | Patch Reef Title Company Inc | |
| Tewey John F | -- | -- | |
| Cragen Patricia L | $79,000 | -- | |
| Bentley Edwin G | $73,500 | -- |
Source: Public Records
Mortgage History
| Date | Status | Borrower | Loan Amount |
|---|---|---|---|
| Previous Owner | Tewey John F | $68,625 |
Source: Public Records
Tax History Compared to Growth
Tax History
| Year | Tax Paid | Tax Assessment Tax Assessment Total Assessment is a certain percentage of the fair market value that is determined by local assessors to be the total taxable value of land and additions on the property. | Land | Improvement |
|---|---|---|---|---|
| 2025 | $3,883 | $244,730 | -- | -- |
| 2024 | $3,685 | $222,482 | -- | -- |
| 2023 | $3,685 | $202,257 | $0 | $0 |
| 2022 | $3,056 | $183,870 | $0 | $183,870 |
| 2021 | $2,490 | $135,282 | $0 | $0 |
| 2020 | $2,146 | $123,000 | $0 | $0 |
| 2019 | $2,016 | $118,000 | $0 | $0 |
| 2018 | $1,864 | $113,000 | $0 | $0 |
| 2017 | $1,666 | $109,000 | $0 | $0 |
| 2016 | $1,428 | $84,000 | $0 | $84,000 |
| 2015 | $1,231 | $82,000 | $0 | $82,000 |
| 2014 | $1,231 | $75,000 | $0 | $75,000 |
Source: Public Records
Map
Nearby Homes
- 6303 SE Williamsburg Dr Unit 201
- 6941 SE Constitution Blvd Unit 203
- 6980 SE Constitution Blvd Unit 203
- 6217 SE Baltusrol Terrace
- 7104 SE Bunker Hill Dr
- 7210 SE Quincy Terrace
- 6764 SE Bunker Hill Dr
- 6102 SE Oakmont Place
- 6581 SE Baltusrol Terrace
- 6250 SE Tory Place
- 6114 SE Georgetown Place
- 6893 SE Bunker Hill Dr
- 6022 SE Oakmont Place
- 6481 SE Winged Foot Dr
- 6984 SE Bunker Hill Dr
- 6140 SE Georgetown Place
- 6136 SE Georgetown Place
- 6148 SE Georgetown Place Unit 805
- 6420 SE Winged Foot Dr
- 6236 SE Ames Way
- 6303 SE Wmsburg Dr Unit 203
- 6303 SE Wmsburg Dr Unit 202
- 6303 SE Wmsburg Dr Unit 104
- 6303 SE Wmsburg Dr Unit 102
- 6303 SE Wmsburg Dr Unit 101
- 6303 SE Wmsburg Dr Unit 204
- 6303 SE Wmsburg Dr Unit 103
- 6303 SE Williamsburg Dr Unit 101
- 6303 SE Williamsburg Dr Unit 102
- 6303 SE Williamsburg Dr Unit 104
- 6303 SE Williamsburg Dr Unit 103
- 6303 SE Williamsburg Dr Unit 204
- 6363 SE Williamsburg Dr Unit 204
- 6363 SE Williamsburg Dr
- 6363 SE Williamsburg Dr Unit 202
- 6363 SE Williamsburg Dr
- 6363 SE Williamsburg Dr
- 6363 SE Williamsburg Dr
- 6363 SE Williamsburg Dr
- 6363 SE Williamsburg Dr Unit 204