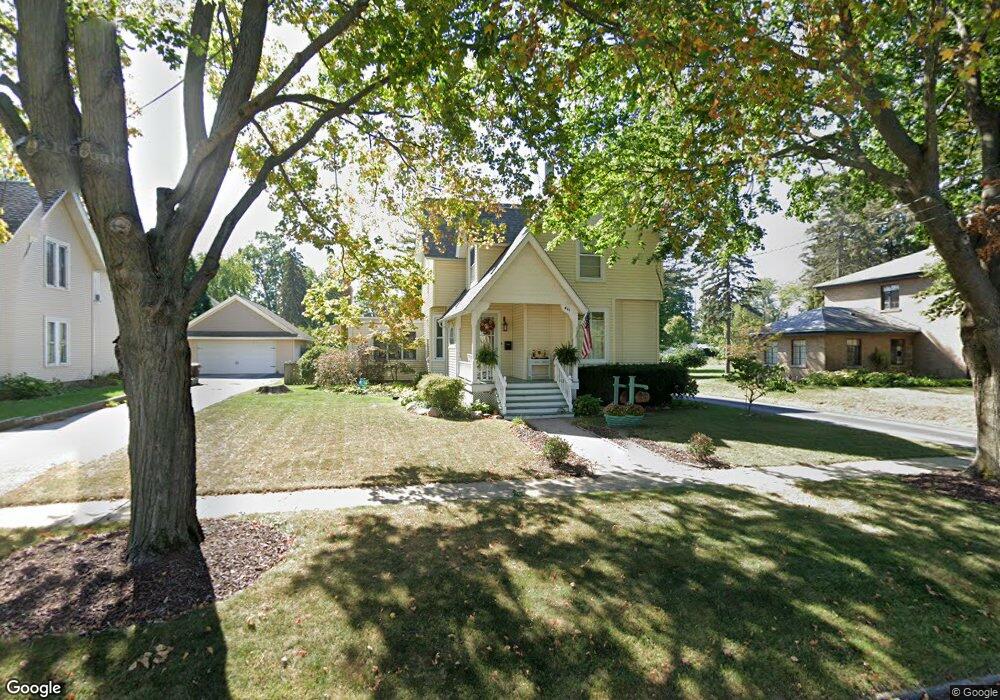
631 W Washington St Marengo, IL 60152
Estimated Value: $264,000 - $296,011
3
Beds
2
Baths
2,200
Sq Ft
$130/Sq Ft
Est. Value
About This Home
This home is located at 631 W Washington St, Marengo, IL 60152 and is currently estimated at $286,003, approximately $130 per square foot. 631 W Washington St is a home located in McHenry County with nearby schools including Locust Elementary School, Marengo Community Middle School, and Marengo Community High School.
Ownership History
Date
Name
Owned For
Owner Type
Purchase Details
Closed on
Aug 25, 2006
Sold by
Dunn Raymond E and Dunn Suzanne L
Bought by
Bohm Rodney
Current Estimated Value
Home Financials for this Owner
Home Financials are based on the most recent Mortgage that was taken out on this home.
Original Mortgage
$188,891
Outstanding Balance
$114,053
Interest Rate
6.77%
Mortgage Type
FHA
Estimated Equity
$171,950
Purchase Details
Closed on
Sep 28, 2000
Sold by
Moss Michael S
Bought by
Dunn Raymond E and Dunn Suzanne L
Home Financials for this Owner
Home Financials are based on the most recent Mortgage that was taken out on this home.
Original Mortgage
$100,000
Interest Rate
7.98%
Purchase Details
Closed on
Feb 29, 1996
Sold by
Graff Howard F and Graff Geraldine Lea
Bought by
Moss Michael S
Home Financials for this Owner
Home Financials are based on the most recent Mortgage that was taken out on this home.
Original Mortgage
$96,400
Interest Rate
7.07%
Create a Home Valuation Report for This Property
The Home Valuation Report is an in-depth analysis detailing your home's value as well as a comparison with similar homes in the area
Home Values in the Area
Average Home Value in this Area
Purchase History
| Date | Buyer | Sale Price | Title Company |
|---|---|---|---|
| Bohm Rodney | $191,600 | Nlt Title Llc | |
| Dunn Raymond E | $162,500 | -- | |
| Moss Michael S | $120,500 | -- |
Source: Public Records
Mortgage History
| Date | Status | Borrower | Loan Amount |
|---|---|---|---|
| Open | Bohm Rodney | $188,891 | |
| Previous Owner | Dunn Raymond E | $100,000 | |
| Previous Owner | Moss Michael S | $96,400 |
Source: Public Records
Tax History Compared to Growth
Tax History
| Year | Tax Paid | Tax Assessment Tax Assessment Total Assessment is a certain percentage of the fair market value that is determined by local assessors to be the total taxable value of land and additions on the property. | Land | Improvement |
|---|---|---|---|---|
| 2024 | $6,025 | $87,403 | $15,175 | $72,228 |
| 2023 | $5,839 | $77,048 | $13,377 | $63,671 |
| 2022 | $5,712 | $69,676 | $12,097 | $57,579 |
| 2021 | $5,297 | $63,486 | $11,022 | $52,464 |
| 2020 | $5,197 | $60,417 | $10,489 | $49,928 |
| 2019 | $5,484 | $57,245 | $9,938 | $47,307 |
| 2018 | $5,075 | $53,621 | $9,309 | $44,312 |
| 2017 | $4,899 | $50,792 | $8,818 | $41,974 |
| 2016 | $4,721 | $47,456 | $8,239 | $39,217 |
| 2013 | -- | $46,431 | $8,061 | $38,370 |
Source: Public Records
Map
Nearby Homes
- 10 ac U S 20
- 455 Park Dr
- 704 Echo (Lot 21) Trail
- 806 Echo (Lot 22) Trail
- 7 ACRES Menge Rd
- 802 Echo (Lot 23) Trail
- 459 Kennedy St
- 479 Kennedy St
- 579 Johnson St
- 21820 W Railroad St
- 422 Damen St
- 832 Oak Manor Dr
- 212 E Van Buren St
- 906 N State St
- 830 N Taylor St
- 1101 N State St
- 0 Maple St
- 102 6th Ave
- 00 Maple St
- 622 Telegraph St
- 623 W Washington St
- 641 W Washington St
- 630 W Grant Hwy
- 617 W Washington St
- 651 W Washington St
- 632 W Washington St
- 622 W Washington St
- 0 N West St
- 0 N West St Unit MRD06842526
- 611 W Washington St
- 614 W Grant Hwy
- 648 W Washington St
- 608 W Washington St
- 608 W Washington St
- 601 W Washington St
- 615 W Prairie St
- 609 W Prairie St
- 623 W Prairie St
- 603 W Prairie St
- 704 W Grant Hwy