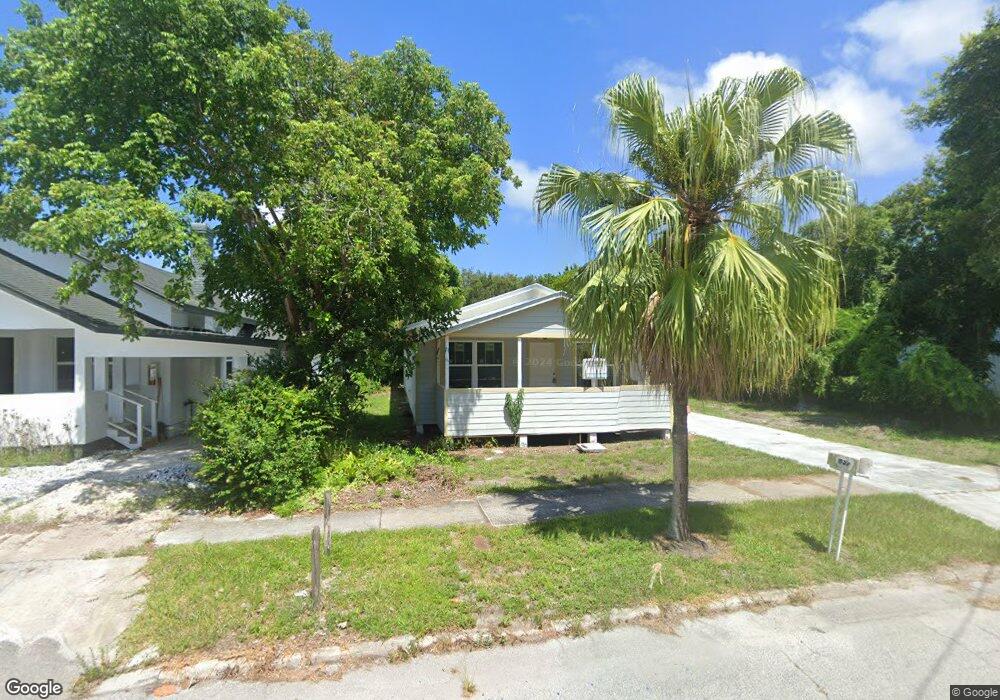
632 S 12th St Fort Pierce, FL 34950
Downtown Fort Pierce NeighborhoodEstimated Value: $144,000 - $270,000
3
Beds
2
Baths
1,270
Sq Ft
$179/Sq Ft
Est. Value
About This Home
This home is located at 632 S 12th St, Fort Pierce, FL 34950 and is currently estimated at $227,624, approximately $179 per square foot. 632 S 12th St is a home located in St. Lucie County with nearby schools including St. Lucie Elementary School, Lawnwood Elementary School, and Chester A. Moore Elementary School.
Ownership History
Date
Name
Owned For
Owner Type
Purchase Details
Closed on
Oct 3, 2012
Sold by
Gardner Robert and Hayek Charles
Bought by
Haygar Enterprises Llc
Current Estimated Value
Purchase Details
Closed on
Jul 23, 2010
Sold by
Whisler Stephen D
Bought by
Gardner Robert S and Hayek Charles C
Purchase Details
Closed on
May 3, 2010
Sold by
Cuker Catherine and Walker Diana
Bought by
Whisler Stephen D
Purchase Details
Closed on
Apr 20, 2010
Sold by
Whisler Lennis K and Whisler Richard A
Bought by
Cuker Catherine and Walker Diana
Create a Home Valuation Report for This Property
The Home Valuation Report is an in-depth analysis detailing your home's value as well as a comparison with similar homes in the area
Home Values in the Area
Average Home Value in this Area
Purchase History
| Date | Buyer | Sale Price | Title Company |
|---|---|---|---|
| Haygar Enterprises Llc | $109,100 | Attorney | |
| Gardner Robert S | $34,000 | Atlantic Coastal Title Corp | |
| Whisler Stephen D | $22,900 | Attorney | |
| Cuker Catherine | -- | Attorney |
Source: Public Records
Tax History Compared to Growth
Tax History
| Year | Tax Paid | Tax Assessment Tax Assessment Total Assessment is a certain percentage of the fair market value that is determined by local assessors to be the total taxable value of land and additions on the property. | Land | Improvement |
|---|---|---|---|---|
| 2024 | $2,244 | $193,500 | $76,200 | $117,300 |
| 2023 | $2,244 | $182,000 | $65,100 | $116,900 |
| 2022 | $2,016 | $158,300 | $60,500 | $97,800 |
| 2021 | $1,728 | $117,300 | $39,500 | $77,800 |
| 2020 | $1,446 | $84,600 | $19,000 | $65,600 |
| 2019 | $1,376 | $82,100 | $16,000 | $66,100 |
| 2018 | $1,162 | $71,200 | $12,800 | $58,400 |
| 2017 | $1,016 | $54,900 | $11,500 | $43,400 |
| 2016 | $792 | $28,700 | $6,100 | $22,600 |
| 2015 | $771 | $27,400 | $6,100 | $21,300 |
| 2014 | $765 | $27,900 | $0 | $0 |
Source: Public Records
Map
Nearby Homes