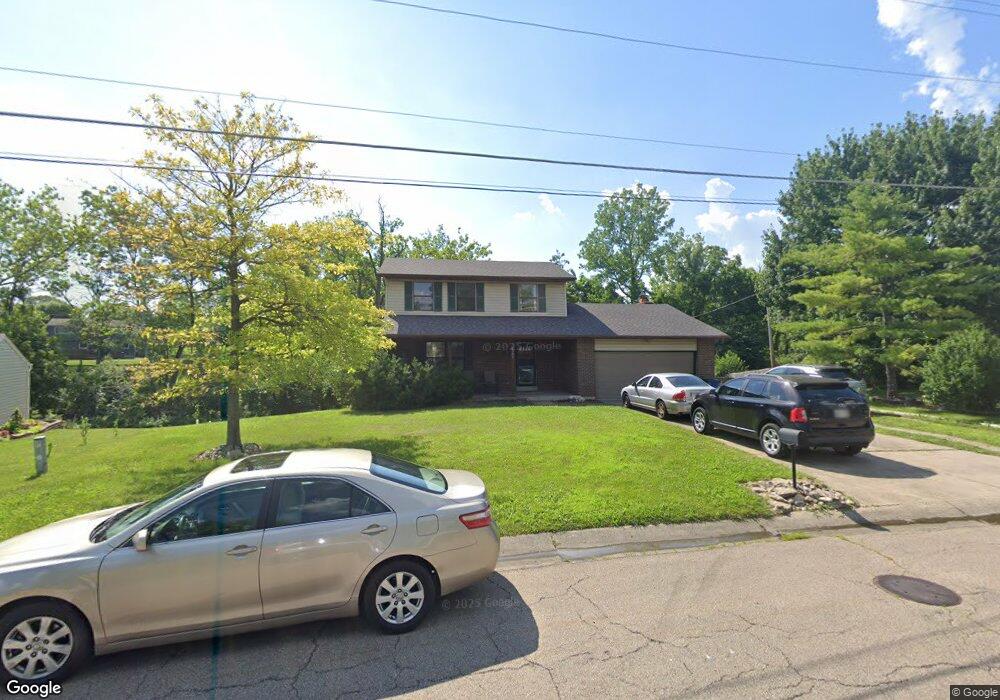
6329 Chablis Dr Liberty Township, OH 45011
Estimated Value: $323,000 - $370,000
3
Beds
3
Baths
2,097
Sq Ft
$165/Sq Ft
Est. Value
About This Home
This home is located at 6329 Chablis Dr, Liberty Township, OH 45011 and is currently estimated at $345,613, approximately $164 per square foot. 6329 Chablis Dr is a home located in Butler County with nearby schools including Cherokee Elementary School, Heritage Early Childhood School, and Lakota Plains Junior School.
Ownership History
Date
Name
Owned For
Owner Type
Purchase Details
Closed on
Nov 3, 2017
Sold by
Conch Brothers Llc
Bought by
Dexter Norman Peter
Current Estimated Value
Purchase Details
Closed on
Sep 21, 2017
Sold by
Carter Angela M
Bought by
Conch Brothers Llc
Purchase Details
Closed on
Jun 18, 2009
Sold by
Barnett Sherry
Bought by
Carter Derrick D and Carter Angela M
Home Financials for this Owner
Home Financials are based on the most recent Mortgage that was taken out on this home.
Original Mortgage
$176,536
Interest Rate
4.94%
Mortgage Type
FHA
Purchase Details
Closed on
Apr 15, 2009
Sold by
Barnett Ronald
Bought by
Barnett Sherry
Purchase Details
Closed on
Aug 28, 2001
Sold by
Cynthia Mitchell
Bought by
Barnett Ronald and Barnett Sherry
Home Financials for this Owner
Home Financials are based on the most recent Mortgage that was taken out on this home.
Original Mortgage
$151,950
Interest Rate
9.82%
Mortgage Type
Purchase Money Mortgage
Create a Home Valuation Report for This Property
The Home Valuation Report is an in-depth analysis detailing your home's value as well as a comparison with similar homes in the area
Home Values in the Area
Average Home Value in this Area
Purchase History
| Date | Buyer | Sale Price | Title Company |
|---|---|---|---|
| Dexter Norman Peter | $158,000 | None Available | |
| Conch Brothers Llc | $143,000 | None Available | |
| Carter Derrick D | $180,000 | Chamberlin Title Agency Ltd | |
| Barnett Sherry | -- | Attorney | |
| Barnett Ronald | $150,000 | -- |
Source: Public Records
Mortgage History
| Date | Status | Borrower | Loan Amount |
|---|---|---|---|
| Previous Owner | Carter Derrick D | $176,536 | |
| Previous Owner | Barnett Ronald | $151,950 |
Source: Public Records
Tax History Compared to Growth
Tax History
| Year | Tax Paid | Tax Assessment Tax Assessment Total Assessment is a certain percentage of the fair market value that is determined by local assessors to be the total taxable value of land and additions on the property. | Land | Improvement |
|---|---|---|---|---|
| 2024 | $4,132 | $105,940 | $17,500 | $88,440 |
| 2023 | $4,081 | $106,100 | $17,500 | $88,600 |
| 2022 | $3,573 | $72,640 | $17,500 | $55,140 |
| 2021 | $3,554 | $72,640 | $17,500 | $55,140 |
| 2020 | $3,646 | $72,640 | $17,500 | $55,140 |
| 2019 | $5,950 | $61,770 | $16,250 | $45,520 |
| 2018 | $3,652 | $61,770 | $16,250 | $45,520 |
| 2017 | $3,718 | $61,770 | $16,250 | $45,520 |
| 2016 | $3,452 | $54,750 | $16,250 | $38,500 |
| 2015 | $3,147 | $54,750 | $16,250 | $38,500 |
| 2014 | $3,387 | $54,750 | $16,250 | $38,500 |
| 2013 | $3,387 | $56,920 | $16,250 | $40,670 |
Source: Public Records
Map
Nearby Homes
- 4296 Moselle Dr
- 4300 Pheasant Trail Ct
- 6384 S Snowmass Dr
- 6093 Griffin Ct
- 4600 Snowbird Dr
- 1 Princeton Rd
- 6077 Snow Hill Dr
- 4628 Beech Knoll Ln
- 4077 Bramble Ct
- 6406 Whippoorwill Dr
- 6406 Whippoorwill Way
- 4004 Bayberry Dr
- 4354 Cody Brook Dr
- 4368 Stone Trace Ln
- 4925 Fescue Dr
- 4328 Palomino Ln
- 4334 Palomino Ln
- 4832 Willow Ridge Dr
- 5870 Shetland Ct
- 4864 Aspen Dr
- 6339 Chablis Dr
- 6321 Chablis Dr
- 6338 Port Ln
- 6318 Port Ln
- 6313 Chablis Dr
- 4318 Moselle Dr
- 6328 Port Ln
- 6342 Chablis Dr
- 6350 Port Ln
- 4306 Moselle Dr
- 6310 Port Ln
- 6305 Chablis Dr
- 6314 Chablis Dr
- 4348 Moselle Dr
- 6297 Chablis Dr
- 6302 Port Ln
- 4319 Moselle Dr
- 4358 Moselle Dr
- 6301 Summerville Ln
- 6306 Chablis Dr