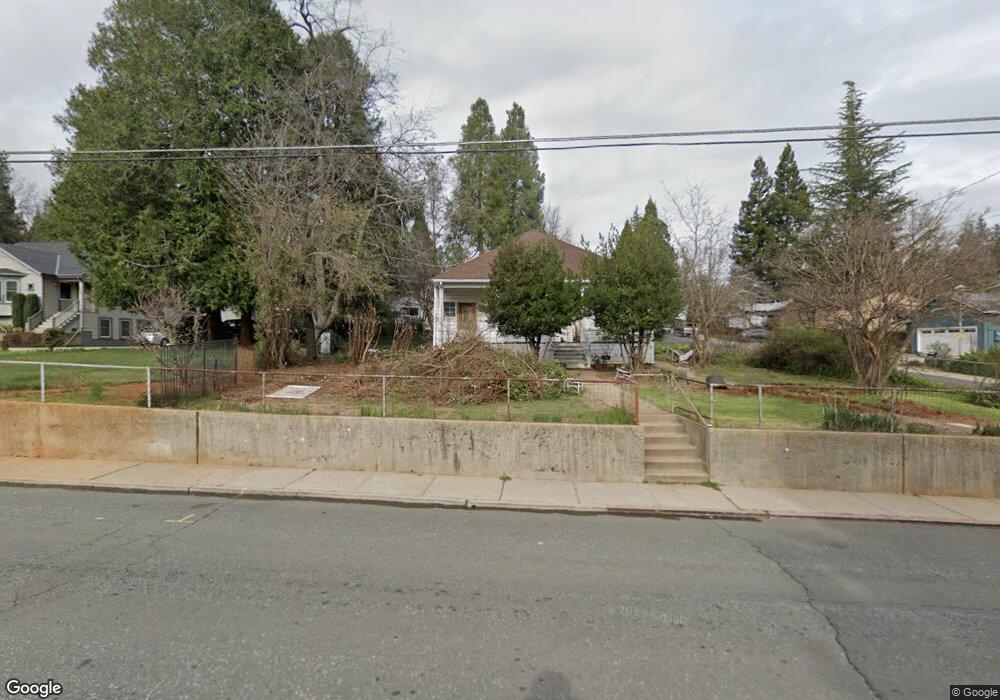
634 Brighton St Grass Valley, CA 95945
Estimated Value: $394,000 - $439,000
2
Beds
1
Bath
1,356
Sq Ft
$302/Sq Ft
Est. Value
About This Home
This home is located at 634 Brighton St, Grass Valley, CA 95945 and is currently estimated at $409,425, approximately $301 per square foot. 634 Brighton St is a home located in Nevada County with nearby schools including Bell Hill Academy, Margaret G. Scotten Elementary School, and Lyman Gilmore Middle School.
Ownership History
Date
Name
Owned For
Owner Type
Purchase Details
Closed on
Sep 29, 2010
Sold by
Lind Franklin
Bought by
Lind Franklin and Hills Carol L
Current Estimated Value
Purchase Details
Closed on
Sep 23, 2003
Sold by
Gensley Joseph J and Gensley Lois J
Bought by
Lind Franklin
Home Financials for this Owner
Home Financials are based on the most recent Mortgage that was taken out on this home.
Original Mortgage
$25,000
Outstanding Balance
$11,542
Interest Rate
6.17%
Mortgage Type
Credit Line Revolving
Estimated Equity
$397,883
Purchase Details
Closed on
Feb 14, 2003
Sold by
Olsen Linda Ann
Bought by
Lind Frank
Purchase Details
Closed on
Jul 5, 2002
Sold by
Gensley Lois
Bought by
Gensley Joseph J and Gensley Lois J
Purchase Details
Closed on
Jul 17, 1999
Sold by
Hills Lilly J
Bought by
Gensley Lois
Create a Home Valuation Report for This Property
The Home Valuation Report is an in-depth analysis detailing your home's value as well as a comparison with similar homes in the area
Home Values in the Area
Average Home Value in this Area
Purchase History
| Date | Buyer | Sale Price | Title Company |
|---|---|---|---|
| Lind Franklin | -- | None Available | |
| Lind Franklin | -- | California Land Title Co | |
| Lind Frank | $100,000 | -- | |
| Gensley Joseph J | -- | -- | |
| Gensley Lois | -- | -- |
Source: Public Records
Mortgage History
| Date | Status | Borrower | Loan Amount |
|---|---|---|---|
| Open | Lind Franklin | $25,000 | |
| Closed | Lind Franklin | $75,000 |
Source: Public Records
Tax History Compared to Growth
Tax History
| Year | Tax Paid | Tax Assessment Tax Assessment Total Assessment is a certain percentage of the fair market value that is determined by local assessors to be the total taxable value of land and additions on the property. | Land | Improvement |
|---|---|---|---|---|
| 2025 | $1,694 | $160,132 | $48,677 | $111,455 |
| 2024 | $2,300 | $156,993 | $47,723 | $109,270 |
| 2023 | $2,300 | $153,916 | $46,788 | $107,128 |
| 2022 | $2,553 | $150,899 | $45,871 | $105,028 |
| 2021 | $1,582 | $147,941 | $44,972 | $102,969 |
| 2020 | $1,580 | $146,425 | $44,511 | $101,914 |
| 2019 | $1,515 | $143,555 | $43,639 | $99,916 |
| 2018 | $1,507 | $140,741 | $42,784 | $97,957 |
| 2017 | $1,447 | $137,983 | $41,946 | $96,037 |
| 2016 | $1,394 | $135,278 | $41,124 | $94,154 |
| 2015 | $1,374 | $133,247 | $40,507 | $92,740 |
| 2014 | -- | $130,638 | $39,714 | $90,924 |
Source: Public Records
Map
Nearby Homes
- 17 Juan Way
- 41 Candy Ln
- 245 Cornwall Ave
- 116 Independence Ct
- 28 Primrose Ln
- 351 Rhode Island St
- 46 Wendy Cir
- 320 Rhode Island St
- 64 Primrose Ln
- 12566 Allison Ranch Rd
- 435 Mill St
- 617 Walsh St Unit 13
- 403 Mill St
- 340 S Church St
- 502 Granite Hill Ct
- 319 Pleasant St
- 358 Mill St
- 517 Mill St
- 10683 Walker Dr
- 348 Marshall St