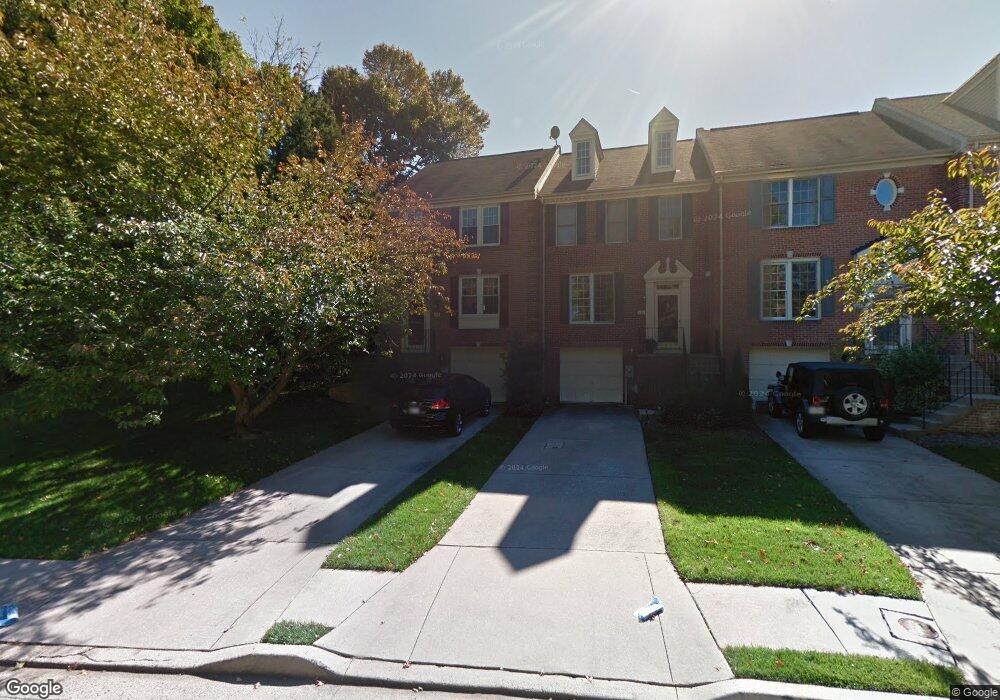
634 Budleigh Cir Lutherville Timonium, MD 21093
Estimated Value: $468,000 - $501,000
--
Bed
3
Baths
1,452
Sq Ft
$332/Sq Ft
Est. Value
About This Home
This home is located at 634 Budleigh Cir, Lutherville Timonium, MD 21093 and is currently estimated at $482,364, approximately $332 per square foot. 634 Budleigh Cir is a home located in Baltimore County with nearby schools including Mays Chapel Elementary School, Ridgely Middle, and Dulaney High School.
Ownership History
Date
Name
Owned For
Owner Type
Purchase Details
Closed on
Jan 27, 2022
Sold by
Said Emge Layla
Bought by
Dhia M Said Living Trust
Current Estimated Value
Purchase Details
Closed on
Feb 6, 2019
Sold by
Emge Layla Said and Dhia M Said Living Trust
Bought by
Said Nada Jasmine
Purchase Details
Closed on
May 5, 2009
Sold by
Said Dhia M
Bought by
Emge Layla Said
Purchase Details
Closed on
Mar 21, 2007
Sold by
Said Dhia M
Bought by
Said Dhia M
Purchase Details
Closed on
Sep 8, 2006
Sold by
Said Dhia M
Bought by
Said Dhia M
Purchase Details
Closed on
Dec 6, 2004
Sold by
Hanover Bryan S
Bought by
Said Dhia M
Purchase Details
Closed on
Nov 19, 2004
Sold by
Hanover Bryan S
Bought by
Said Dhia M
Purchase Details
Closed on
Oct 11, 2002
Sold by
Kennedy Anne K
Bought by
Hanover Bryan S
Purchase Details
Closed on
Jan 19, 2001
Sold by
Wentworth William Patrick
Bought by
Kennedy Anne K
Create a Home Valuation Report for This Property
The Home Valuation Report is an in-depth analysis detailing your home's value as well as a comparison with similar homes in the area
Home Values in the Area
Average Home Value in this Area
Purchase History
| Date | Buyer | Sale Price | Title Company |
|---|---|---|---|
| Dhia M Said Living Trust | -- | None Listed On Document | |
| Said Nada Jasmine | -- | None Available | |
| Emge Layla Said | -- | -- | |
| Said Dhia M | -- | -- | |
| Said Dhia M | -- | -- | |
| Said Dhia M | $310,000 | -- | |
| Said Dhia M | $310,000 | -- | |
| Hanover Bryan S | $247,500 | -- | |
| Kennedy Anne K | $198,500 | -- |
Source: Public Records
Tax History Compared to Growth
Tax History
| Year | Tax Paid | Tax Assessment Tax Assessment Total Assessment is a certain percentage of the fair market value that is determined by local assessors to be the total taxable value of land and additions on the property. | Land | Improvement |
|---|---|---|---|---|
| 2025 | $4,865 | $348,600 | $140,000 | $208,600 |
| 2024 | $4,865 | $336,900 | $0 | $0 |
| 2023 | $2,376 | $325,200 | $0 | $0 |
| 2022 | $4,512 | $313,500 | $140,000 | $173,500 |
| 2021 | $4,500 | $312,500 | $0 | $0 |
| 2020 | $3,775 | $311,500 | $0 | $0 |
| 2019 | $3,763 | $310,500 | $140,000 | $170,500 |
| 2018 | $4,375 | $305,733 | $0 | $0 |
| 2017 | $4,401 | $300,967 | $0 | $0 |
| 2016 | $3,924 | $296,200 | $0 | $0 |
| 2015 | $3,924 | $294,600 | $0 | $0 |
| 2014 | $3,924 | $293,000 | $0 | $0 |
Source: Public Records
Map
Nearby Homes
- 28 Alderman Ct
- 608 Budleigh Cir
- 11817 Sherbourne Dr
- 6 Tenby Ct
- 640 Lavenham Ct
- 673 Budleigh Cir
- 692 Budleigh Cir
- 24 Merrion Ct
- 10 Merrion Ct
- 528 Kinsale Rd
- 20 Culmore Ct
- 2 Brooking Ct Unit 102
- 2 Elphin Ct Unit 302
- 4 Culmore Ct
- 6 Belmullet Ct Unit 202
- 4 Belmullet Ct Unit 202
- 10 Bandon Ct Unit 301
- 10 Bandon Ct Unit 302
- 704 Chapel Ridge Rd
- 215 Belmont Forest Ct Unit 108
- 632 Budleigh Cir
- 630 Budleigh Cir
- 628 Budleigh Cir
- 626 Budleigh Cir
- 624 Budleigh Cir
- 44 Alderman Ct
- 42 Alderman Ct
- 46 Alderman Ct
- 40 Alderman Ct
- 48 Alderman Ct
- 619 Budleigh Cir
- 50 Alderman Ct
- 621 Budleigh Cir
- 617 Budleigh Cir
- 623 Budleigh Cir
- 615 Budleigh Cir
- 615R Budleigh Cir
- 38 Alderman Ct
- 622 Budleigh Cir
- 625 Budleigh Cir