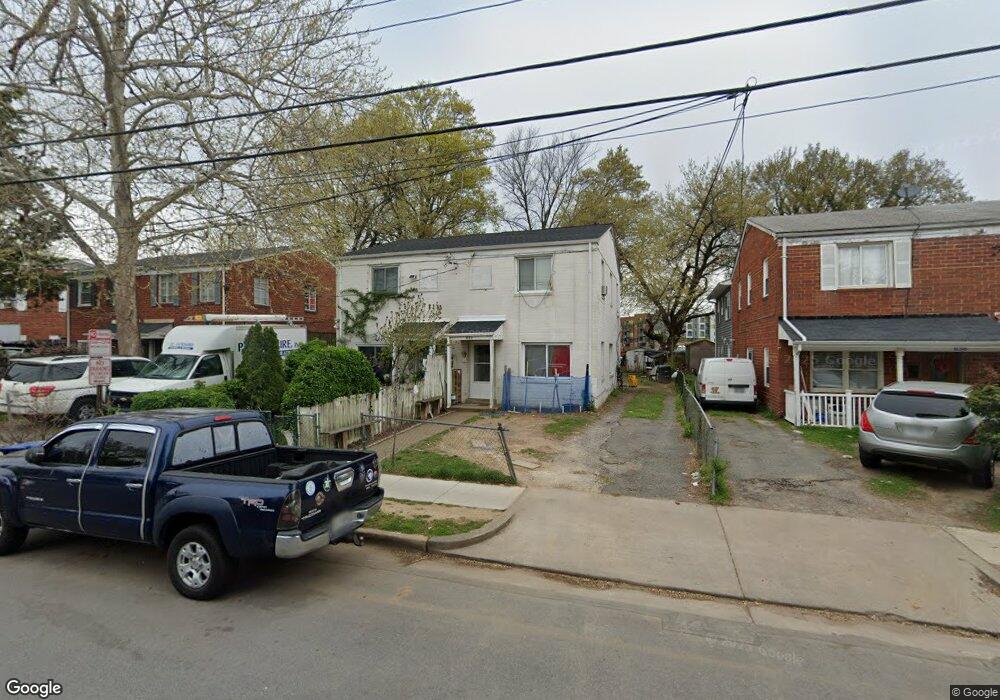
634 Four Mile Rd Alexandria, VA 22305
Arlandria NeighborhoodEstimated Value: $419,000 - $513,000
--
Bed
--
Bath
1,056
Sq Ft
$447/Sq Ft
Est. Value
About This Home
This home is located at 634 Four Mile Rd, Alexandria, VA 22305 and is currently estimated at $471,618, approximately $446 per square foot. 634 Four Mile Rd is a home located in Alexandria City with nearby schools including George Mason Elementary School, George Washington Middle School, and Alexandria City High School.
Ownership History
Date
Name
Owned For
Owner Type
Purchase Details
Closed on
Oct 24, 2003
Sold by
Solis Manuel
Bought by
Mendoza Walter
Current Estimated Value
Home Financials for this Owner
Home Financials are based on the most recent Mortgage that was taken out on this home.
Original Mortgage
$208,354
Outstanding Balance
$96,830
Interest Rate
6.15%
Mortgage Type
FHA
Estimated Equity
$374,788
Purchase Details
Closed on
Jun 30, 1998
Sold by
Oliva Juan A
Bought by
Solis Solis Manuel Manuel and Solis Blanca M
Home Financials for this Owner
Home Financials are based on the most recent Mortgage that was taken out on this home.
Original Mortgage
$104,000
Interest Rate
7.04%
Purchase Details
Closed on
Jan 3, 1997
Sold by
Sullivan + Edmund J and Rosemari G Sullivan +
Bought by
Oliva Juan A
Home Financials for this Owner
Home Financials are based on the most recent Mortgage that was taken out on this home.
Original Mortgage
$58,800
Interest Rate
7.48%
Mortgage Type
New Conventional
Create a Home Valuation Report for This Property
The Home Valuation Report is an in-depth analysis detailing your home's value as well as a comparison with similar homes in the area
Home Values in the Area
Average Home Value in this Area
Purchase History
| Date | Buyer | Sale Price | Title Company |
|---|---|---|---|
| Mendoza Walter | $210,000 | -- | |
| Solis Solis Manuel Manuel | $105,000 | -- | |
| Oliva Juan A | $73,500 | Island Title Corp |
Source: Public Records
Mortgage History
| Date | Status | Borrower | Loan Amount |
|---|---|---|---|
| Open | Oliva Juan A | $208,354 | |
| Previous Owner | Solis Solis Manuel Manuel | $104,000 | |
| Previous Owner | Oliva Juan A | $58,800 |
Source: Public Records
Tax History Compared to Growth
Tax History
| Year | Tax Paid | Tax Assessment Tax Assessment Total Assessment is a certain percentage of the fair market value that is determined by local assessors to be the total taxable value of land and additions on the property. | Land | Improvement |
|---|---|---|---|---|
| 2025 | $5,401 | $420,058 | $276,576 | $143,482 |
| 2024 | $5,401 | $420,058 | $276,576 | $143,482 |
| 2023 | $4,663 | $420,058 | $276,576 | $143,482 |
| 2022 | $4,268 | $384,515 | $242,610 | $141,905 |
| 2021 | $3,669 | $330,511 | $192,548 | $137,963 |
| 2020 | $4,160 | $326,569 | $192,548 | $134,021 |
| 2019 | $3,690 | $326,569 | $192,548 | $134,021 |
| 2018 | $3,690 | $326,569 | $192,548 | $134,021 |
| 2017 | $3,640 | $322,150 | $192,548 | $129,602 |
| 2016 | $3,122 | $290,926 | $161,324 | $129,602 |
| 2015 | $2,946 | $282,413 | $147,794 | $134,619 |
| 2014 | $2,941 | $281,959 | $147,794 | $134,165 |
Source: Public Records
Map
Nearby Homes
- 3941 Old Dominion Blvd
- 3911 Old Dominion Blvd
- 3836 Brighton Ct
- 464 W Glebe Rd
- 904 W Glebe Rd
- 900 28th St S
- 2630 S Lynn St
- 2647 S Kent St
- 3009 S Hill St
- 0 28th St S
- 250 Aspen St
- 2424 S Queen St
- 3306 Landover St
- 2301 25th St S Unit 4306
- 210 Aspen St
- 3203 Circle Hill Rd
- 31 W Reed Ave
- 2465 Army Navy Dr Unit 1203
- 2465 Army Navy Dr Unit 204
- 1225 Martha Custis Dr Unit 919
- 636 Four Mile Rd
- 632 Four Mile Rd
- 638 Four Mile Rd
- 630 Notabene Dr
- 628 Four Mile Rd
- 701 Four Mile Rd
- 703 Four Mile Rd
- 707 Four Mile Rd
- 709 Four Mile Rd
- 711 Four Mile Rd
- 641 Notabene Dr
- 649 Notabene Dr
- 713 Four Mile Rd
- 713 Four Mile Rd Unit 1
- 715 Four Mile Rd
- 601 Four Mile Rd
- 625 Notabene Dr
- 717 Four Mile Rd
- 719 Four Mile Rd
- 3910 Old Dominion Blvd