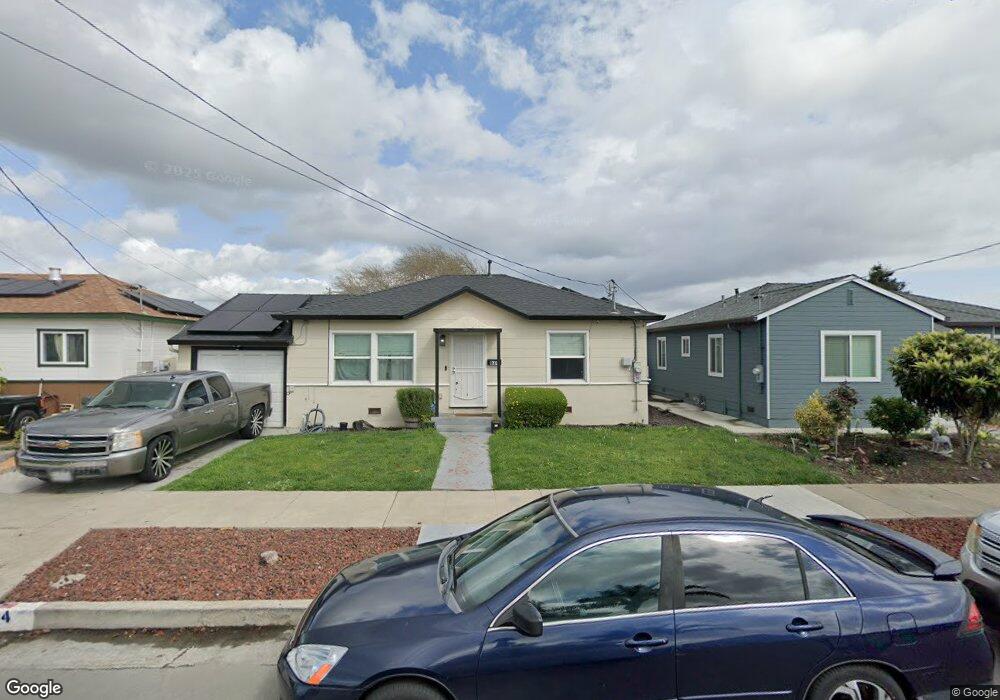
634 S 21st St Richmond, CA 94804
Coronado NeighborhoodEstimated Value: $444,000 - $647,000
2
Beds
1
Bath
1,089
Sq Ft
$508/Sq Ft
Est. Value
About This Home
This home is located at 634 S 21st St, Richmond, CA 94804 and is currently estimated at $553,271, approximately $508 per square foot. 634 S 21st St is a home located in Contra Costa County with nearby schools including Coronado Elementary School, Lovonya DeJean Middle School, and John F. Kennedy High School.
Ownership History
Date
Name
Owned For
Owner Type
Purchase Details
Closed on
Jul 26, 2022
Sold by
Padilla Rios Adolfo and Serratos Ana
Bought by
Rios Adolfo Padilla and Villasenor Ana Karen
Current Estimated Value
Home Financials for this Owner
Home Financials are based on the most recent Mortgage that was taken out on this home.
Original Mortgage
$415,611
Outstanding Balance
$397,440
Interest Rate
5.54%
Mortgage Type
FHA
Estimated Equity
$155,831
Purchase Details
Closed on
Dec 8, 2021
Sold by
Serratos Christian
Bought by
Rios Adolfo Padilla and Villasenor Ana Karen
Purchase Details
Closed on
Sep 14, 2018
Sold by
Burns Jordan
Bought by
Serratos Christian
Home Financials for this Owner
Home Financials are based on the most recent Mortgage that was taken out on this home.
Original Mortgage
$413,250
Interest Rate
4.6%
Mortgage Type
New Conventional
Purchase Details
Closed on
Apr 24, 2018
Sold by
Stubbs Malcom Garvey
Bought by
Burns Jordan
Create a Home Valuation Report for This Property
The Home Valuation Report is an in-depth analysis detailing your home's value as well as a comparison with similar homes in the area
Home Values in the Area
Average Home Value in this Area
Purchase History
| Date | Buyer | Sale Price | Title Company |
|---|---|---|---|
| Rios Adolfo Padilla | $208,000 | Stewart Title Of California | |
| Rios Adolfo Padilla | -- | None Available | |
| Serratos Christian | $435,000 | North American Title Company | |
| Burns Jordan | $330,000 | Stewart Title Company |
Source: Public Records
Mortgage History
| Date | Status | Borrower | Loan Amount |
|---|---|---|---|
| Open | Rios Adolfo Padilla | $415,611 | |
| Previous Owner | Serratos Christian | $413,250 |
Source: Public Records
Tax History Compared to Growth
Tax History
| Year | Tax Paid | Tax Assessment Tax Assessment Total Assessment is a certain percentage of the fair market value that is determined by local assessors to be the total taxable value of land and additions on the property. | Land | Improvement |
|---|---|---|---|---|
| 2025 | $8,577 | $510,525 | $381,359 | $129,166 |
| 2024 | $8,442 | $500,516 | $373,882 | $126,634 |
| 2023 | $8,442 | $490,702 | $366,551 | $124,151 |
| 2022 | $7,951 | $457,261 | $336,376 | $120,885 |
| 2021 | $7,875 | $448,296 | $329,781 | $118,515 |
| 2019 | $11,197 | $435,000 | $320,000 | $115,000 |
| 2018 | $1,962 | $36,609 | $15,047 | $21,562 |
| 2017 | $1,569 | $35,892 | $14,752 | $21,140 |
| 2016 | $1,506 | $35,189 | $14,463 | $20,726 |
| 2015 | $1,461 | $34,661 | $14,246 | $20,415 |
| 2014 | $1,458 | $33,983 | $13,967 | $20,016 |
Source: Public Records
Map
Nearby Homes
- 557 S 22nd St
- 628 S 17th St
- 5146 Blossom Cir
- 1817 Virginia Ave
- 1503 Jetty Dr
- 1496 Seawind Dr
- 2502 Jetty Dr Unit 152
- 447 S 16th St
- 201 Jetty Dr
- 1465 Latitudes Way
- 1426 Seawind Dr
- 104 Jetty Dr
- 715 S 29th St
- 863 Lookout St
- 338 S 16th St
- 330 S 16th St
- 113 Schooner Ct
- 2626 Maine Ave
- 2605 Beach Head Ct
- 350 Marina Way S