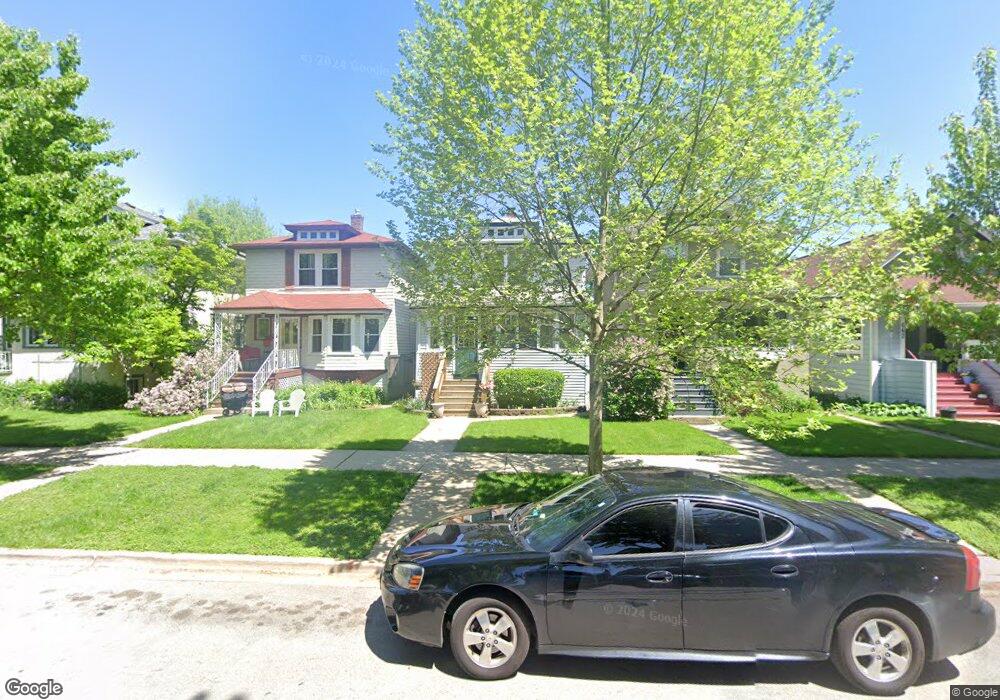
634 S Harvey Ave Oak Park, IL 60304
Estimated Value: $396,000 - $538,000
3
Beds
2
Baths
1,280
Sq Ft
$352/Sq Ft
Est. Value
About This Home
This home is located at 634 S Harvey Ave, Oak Park, IL 60304 and is currently estimated at $450,198, approximately $351 per square foot. 634 S Harvey Ave is a home located in Cook County with nearby schools including Longfellow Elementary School, Percy Julian Middle School, and Oak Park and River Forest High School.
Ownership History
Date
Name
Owned For
Owner Type
Purchase Details
Closed on
Sep 26, 2001
Sold by
Disantis Deborah A
Bought by
Galindo Gilberto and Aguilar Eva
Current Estimated Value
Home Financials for this Owner
Home Financials are based on the most recent Mortgage that was taken out on this home.
Original Mortgage
$198,000
Outstanding Balance
$78,070
Interest Rate
6.99%
Estimated Equity
$372,128
Purchase Details
Closed on
Jan 8, 1998
Sold by
Wiegand Eileen E
Bought by
Disantis Deborah A
Home Financials for this Owner
Home Financials are based on the most recent Mortgage that was taken out on this home.
Original Mortgage
$143,865
Interest Rate
7.24%
Mortgage Type
FHA
Purchase Details
Closed on
Feb 15, 1994
Sold by
Midwest Bank & Trust Company
Bought by
Glonek Diane Dahms
Home Financials for this Owner
Home Financials are based on the most recent Mortgage that was taken out on this home.
Original Mortgage
$93,472
Interest Rate
7.22%
Mortgage Type
FHA
Create a Home Valuation Report for This Property
The Home Valuation Report is an in-depth analysis detailing your home's value as well as a comparison with similar homes in the area
Home Values in the Area
Average Home Value in this Area
Purchase History
| Date | Buyer | Sale Price | Title Company |
|---|---|---|---|
| Galindo Gilberto | $220,000 | -- | |
| Disantis Deborah A | -- | -- | |
| Glonek Diane Dahms | $63,333 | -- |
Source: Public Records
Mortgage History
| Date | Status | Borrower | Loan Amount |
|---|---|---|---|
| Open | Galindo Gilberto | $198,000 | |
| Previous Owner | Disantis Deborah A | $143,865 | |
| Previous Owner | Glonek Diane Dahms | $93,472 |
Source: Public Records
Tax History Compared to Growth
Tax History
| Year | Tax Paid | Tax Assessment Tax Assessment Total Assessment is a certain percentage of the fair market value that is determined by local assessors to be the total taxable value of land and additions on the property. | Land | Improvement |
|---|---|---|---|---|
| 2024 | $11,307 | $35,799 | $4,375 | $31,424 |
| 2023 | $12,641 | $38,000 | $4,375 | $33,625 |
| 2022 | $12,641 | $36,341 | $3,125 | $33,216 |
| 2021 | $12,352 | $36,340 | $3,125 | $33,215 |
| 2020 | $12,133 | $36,340 | $3,125 | $33,215 |
| 2019 | $11,908 | $34,467 | $2,812 | $31,655 |
| 2018 | $11,459 | $34,467 | $2,812 | $31,655 |
| 2017 | $11,230 | $34,467 | $2,812 | $31,655 |
| 2016 | $10,401 | $28,339 | $2,343 | $25,996 |
| 2015 | $9,274 | $28,339 | $2,343 | $25,996 |
| 2014 | $8,636 | $28,339 | $2,343 | $25,996 |
| 2013 | $8,639 | $29,175 | $2,343 | $26,832 |
Source: Public Records
Map
Nearby Homes
- 617 S Lombard Ave
- 612 S Lombard Ave
- 537 S Harvey Ave
- 537 S Cuyler Ave
- 433 S Lombard Ave Unit 33
- 426 S Lombard Ave Unit 205
- 208 S Austin Blvd
- 514 S Humphrey Ave
- 22 S Austin Blvd
- 243 Washington Blvd Unit 3A
- 241 Washington Blvd Unit G
- 237 Washington Blvd Unit G
- 7639 W Jackson Blvd Unit 1E
- 222 Washington Blvd Unit P14
- 410 S Austin Blvd Unit 3S
- 840 S Cuyler Ave
- 837 S Humphrey Ave
- 847 S Humphrey Ave Unit 1
- 1169 S Taylor Ave
- 331 S Ridgeland Ave Unit B
- 636 S Harvey Ave
- 632 S Harvey Ave
- 642 S Harvey Ave
- 630 S Harvey Ave
- 626 S Harvey Ave
- 626 S Harvey Ave
- 644 S Harvey Ave
- 624 S Harvey Ave
- 650 S Harvey Ave
- 633 S Lombard Ave
- 639 S Lombard Ave
- 622 S Harvey Ave
- 629 S Lombard Ave
- 641 S Lombard Ave
- 633 S Harvey Ave
- 620 S Harvey Ave
- 643 S Lombard Ave
- 625 S Lombard Ave
- 635 S Harvey Ave
- 639 S Harvey Ave