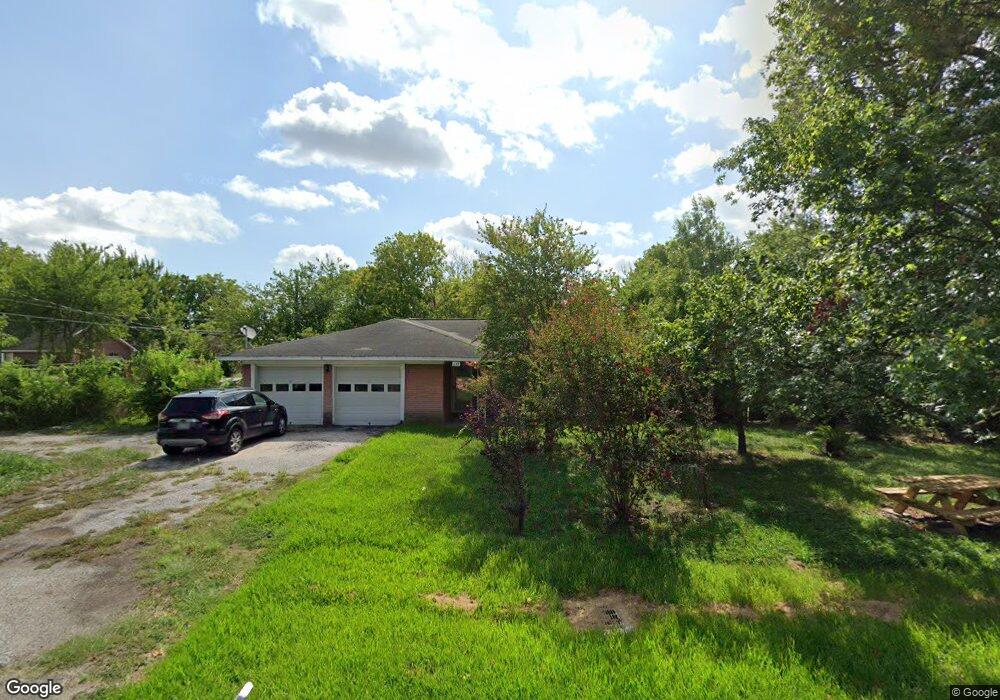
635 Cloverleaf St Houston, TX 77015
Estimated Value: $191,000 - $238,000
3
Beds
2
Baths
1,322
Sq Ft
$159/Sq Ft
Est. Value
About This Home
This home is located at 635 Cloverleaf St, Houston, TX 77015 and is currently estimated at $210,574, approximately $159 per square foot. 635 Cloverleaf St is a home located in Harris County with nearby schools including Sam Houston Elementary School, Cobb 6th Grade Campus, and North Shore Middle School.
Ownership History
Date
Name
Owned For
Owner Type
Purchase Details
Closed on
Oct 8, 2002
Sold by
Cole Robert L
Bought by
Cole Pamela
Current Estimated Value
Purchase Details
Closed on
Nov 21, 1995
Sold by
Cole Pamela and Tinney Pamela
Bought by
Cole Robert L
Create a Home Valuation Report for This Property
The Home Valuation Report is an in-depth analysis detailing your home's value as well as a comparison with similar homes in the area
Home Values in the Area
Average Home Value in this Area
Purchase History
| Date | Buyer | Sale Price | Title Company |
|---|---|---|---|
| Cole Pamela | -- | -- | |
| Cole Robert L | -- | -- |
Source: Public Records
Tax History Compared to Growth
Tax History
| Year | Tax Paid | Tax Assessment Tax Assessment Total Assessment is a certain percentage of the fair market value that is determined by local assessors to be the total taxable value of land and additions on the property. | Land | Improvement |
|---|---|---|---|---|
| 2025 | $296 | $206,785 | $108,600 | $98,185 |
| 2024 | $296 | $214,129 | $108,600 | $105,529 |
| 2023 | $290 | $222,548 | $65,160 | $157,388 |
| 2022 | $2,560 | $178,938 | $65,160 | $113,778 |
| 2021 | $2,516 | $130,912 | $51,586 | $79,326 |
| 2020 | $2,344 | $111,218 | $51,586 | $59,632 |
| 2019 | $2,249 | $87,447 | $51,586 | $35,861 |
| 2018 | $185 | $73,113 | $51,586 | $21,527 |
| 2017 | $1,891 | $67,819 | $51,586 | $16,233 |
| 2016 | $1,742 | $67,819 | $51,586 | $16,233 |
| 2015 | $372 | $67,819 | $51,586 | $16,233 |
| 2014 | $372 | $53,063 | $38,010 | $15,053 |
Source: Public Records
Map
Nearby Homes
- 14334 Texarkana St
- 14512 Texarkana St
- 14500 Corpus Christi St Unit 4
- 14504 Corpus Christi St Unit 4
- 14506 Corpus Christi St Unit 4
- 14615 Victoria St
- 0 Victoria St
- 813 Barbara Mae St
- 639 Manor St
- 14307 Laredo St
- 816 Barbara Mae St
- 638 Hollywood St
- 719 Manor St
- 14619 Brownsville St
- 14613 Hillsboro St
- 14422 Roundstone Ln
- 14131 Woodforest Blvd
- 14143 Roundstone Ln
- 14415 Wadebridge Way
- 530 Frankie St Unit 1
- 14406 Texarkana St
- 643 Cloverleaf St
- 14410 Texarkana St
- 14350 Texarkana St
- 14413 Texarkana St
- 644 Cloverleaf St
- 14353 Texarkana St
- 14339 Eagle Pass St
- 14402 Longview St
- 14416 Eagle Pass St
- 14431 Eagle Pass St
- 14342 Texarkana St
- 14335 Eagle Pass St
- 14350 Eagle Pass St
- 14416 Longview St
- 14340 Texarkana St
- 14343 Texarkana St
- 620 Cloverleaf St
- 0 Eagle Pass St
- 14420 Longview St