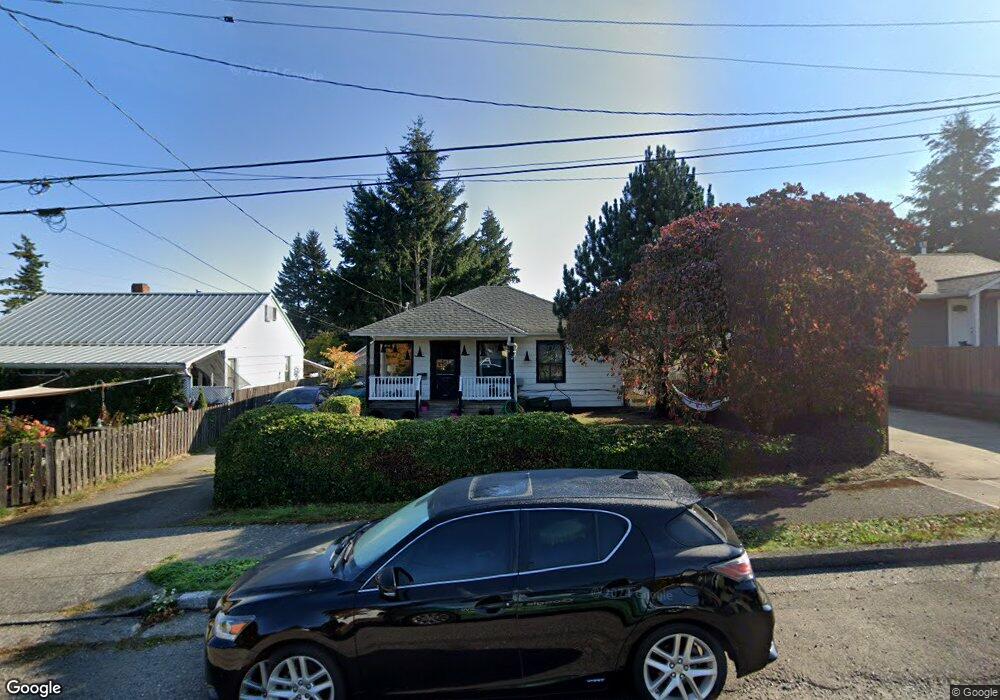
636 N Charlotte Ave Bremerton, WA 98312
Charleston NeighborhoodEstimated Value: $343,964 - $400,000
2
Beds
1
Bath
779
Sq Ft
$464/Sq Ft
Est. Value
About This Home
This home is located at 636 N Charlotte Ave, Bremerton, WA 98312 and is currently estimated at $361,241, approximately $463 per square foot. 636 N Charlotte Ave is a home located in Kitsap County with nearby schools including West Hills S.T.E.M. Academy, Mountain View Middle School, and Bremerton High School.
Ownership History
Date
Name
Owned For
Owner Type
Purchase Details
Closed on
Jan 14, 2021
Sold by
Falotico Jodie and Falotico Nicholas
Bought by
Falotico Nicholas G
Current Estimated Value
Home Financials for this Owner
Home Financials are based on the most recent Mortgage that was taken out on this home.
Original Mortgage
$224,000
Outstanding Balance
$199,921
Interest Rate
2.71%
Mortgage Type
New Conventional
Estimated Equity
$161,320
Purchase Details
Closed on
Jan 3, 2006
Sold by
Cates Wendy E
Bought by
Empolen Smith Jodie R and Falotico Nicholas
Home Financials for this Owner
Home Financials are based on the most recent Mortgage that was taken out on this home.
Original Mortgage
$33,000
Interest Rate
6.25%
Mortgage Type
Stand Alone Second
Purchase Details
Closed on
Dec 28, 2005
Sold by
Cates Wendy E
Bought by
Empolen Smith Jodie R and Falotico Nicholas
Home Financials for this Owner
Home Financials are based on the most recent Mortgage that was taken out on this home.
Original Mortgage
$33,000
Interest Rate
6.25%
Mortgage Type
Stand Alone Second
Create a Home Valuation Report for This Property
The Home Valuation Report is an in-depth analysis detailing your home's value as well as a comparison with similar homes in the area
Home Values in the Area
Average Home Value in this Area
Purchase History
| Date | Buyer | Sale Price | Title Company |
|---|---|---|---|
| Falotico Nicholas G | -- | Fidelity Natl Ttl Lynnwood | |
| Empolen Smith Jodie R | $165,280 | Land Title Co | |
| Empolen Smith Jodie R | $165,280 | Land Title Co |
Source: Public Records
Mortgage History
| Date | Status | Borrower | Loan Amount |
|---|---|---|---|
| Open | Falotico Nicholas G | $224,000 | |
| Closed | Empolen Smith Jodie R | $33,000 | |
| Closed | Empolen Smith Jodie R | $132,000 | |
| Closed | Empolen Smith Jodie R | $132,000 |
Source: Public Records
Tax History Compared to Growth
Tax History
| Year | Tax Paid | Tax Assessment Tax Assessment Total Assessment is a certain percentage of the fair market value that is determined by local assessors to be the total taxable value of land and additions on the property. | Land | Improvement |
|---|---|---|---|---|
| 2026 | $2,656 | $301,000 | $85,130 | $215,870 |
| 2025 | $2,656 | $301,000 | $85,130 | $215,870 |
| 2024 | $2,563 | $301,000 | $85,130 | $215,870 |
| 2023 | $2,649 | $301,000 | $85,130 | $215,870 |
| 2022 | $2,457 | $251,000 | $70,940 | $180,060 |
| 2021 | $2,172 | $203,090 | $53,590 | $149,500 |
| 2020 | $2,015 | $188,250 | $49,600 | $138,650 |
| 2019 | $1,738 | $168,210 | $44,270 | $123,940 |
| 2018 | $1,788 | $113,320 | $33,290 | $80,030 |
| 2017 | $1,484 | $113,320 | $33,290 | $80,030 |
| 2016 | $1,384 | $99,980 | $29,210 | $70,770 |
| 2015 | $1,404 | $100,900 | $31,760 | $69,140 |
| 2014 | -- | $96,420 | $31,760 | $64,660 |
| 2013 | -- | $102,660 | $33,520 | $69,140 |
Source: Public Records
Map
Nearby Homes
- 931 Oyster Bay Ct
- 347 Dora Ave
- 500 N National Ave Unit 37
- 923 Pershing Ave Unit 205
- 921 Pershing Ave Unit 203
- 2613 Burwell St
- 1135 Morgan Rd NW Unit A & B
- 1 XXXX 1st St
- 1309 Times Ave
- 1303 Times Ave
- 122 National Ave S
- 320 N Lafayette Ave
- 179 Russell Rd N
- 106 Mcneal Ave
- 114 S Lafayette Ave
- 3728 W Arsenal Way
- 4744 Deadwood St
- 231 S Yantic Ave
- 0 S Hartford Ave
- 4532 Abalone St
- 640 N Charlotte Ave
- 644 N Charlotte Ave
- 635 Bertha Ave
- 637 Bertha Ave
- 628 N Charlotte Ave
- 631 Bertha Ave
- 3703 9th St
- 635 N Charlotte Ave
- 639 N Charlotte Ave
- 622 N Charlotte Ave
- 631 N Charlotte Ave
- 625 Bertha Ave
- 649 N Charlotte Ave
- 618 N Charlotte Ave
- 619 Bertha Ave
- 623 N Charlotte Ave
- 628 Dora Ave
- 634 Bertha Ave
- 612 N Charlotte Ave