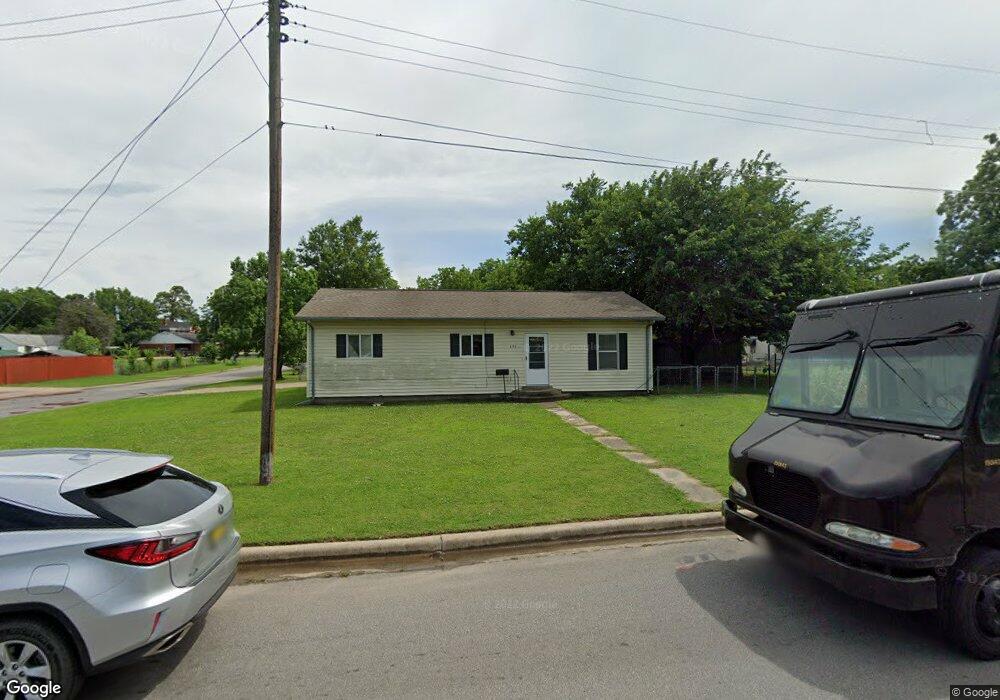
636 Northwest Blvd Ardmore, OK 73401
Estimated Value: $116,011 - $158,000
2
Beds
1
Bath
1,125
Sq Ft
$120/Sq Ft
Est. Value
About This Home
This home is located at 636 Northwest Blvd, Ardmore, OK 73401 and is currently estimated at $135,503, approximately $120 per square foot. 636 Northwest Blvd is a home located in Carter County with nearby schools including Charles Evans Elementary School, Ardmore Middle School, and Ardmore High School.
Ownership History
Date
Name
Owned For
Owner Type
Purchase Details
Closed on
Jul 24, 2014
Sold by
Smith Kelly V and Smith Rebecca M
Bought by
903 Properties Llc
Current Estimated Value
Purchase Details
Closed on
Sep 23, 2011
Sold by
Harper Billy Bob and Harper Joan
Bought by
Smith Kelly V and Smith Rebecca M
Home Financials for this Owner
Home Financials are based on the most recent Mortgage that was taken out on this home.
Original Mortgage
$54,400
Interest Rate
4.34%
Mortgage Type
New Conventional
Purchase Details
Closed on
Oct 16, 2006
Sold by
Stewart Thomas A
Bought by
Harper Billy Bob and Harper Joan
Home Financials for this Owner
Home Financials are based on the most recent Mortgage that was taken out on this home.
Original Mortgage
$62,500
Interest Rate
6.44%
Mortgage Type
New Conventional
Create a Home Valuation Report for This Property
The Home Valuation Report is an in-depth analysis detailing your home's value as well as a comparison with similar homes in the area
Home Values in the Area
Average Home Value in this Area
Purchase History
| Date | Buyer | Sale Price | Title Company |
|---|---|---|---|
| 903 Properties Llc | -- | None Available | |
| Smith Kelly V | $68,000 | None Available | |
| Harper Billy Bob | $69,500 | -- |
Source: Public Records
Mortgage History
| Date | Status | Borrower | Loan Amount |
|---|---|---|---|
| Previous Owner | Smith Kelly V | $54,400 | |
| Previous Owner | Harper Billy Bob | $62,500 |
Source: Public Records
Tax History Compared to Growth
Tax History
| Year | Tax Paid | Tax Assessment Tax Assessment Total Assessment is a certain percentage of the fair market value that is determined by local assessors to be the total taxable value of land and additions on the property. | Land | Improvement |
|---|---|---|---|---|
| 2025 | $979 | $10,411 | $2,256 | $8,155 |
| 2024 | $979 | $9,916 | $2,149 | $7,767 |
| 2023 | $933 | $9,443 | $2,124 | $7,319 |
| 2022 | $860 | $8,994 | $2,095 | $6,899 |
| 2021 | $864 | $8,566 | $2,052 | $6,514 |
| 2020 | $811 | $8,157 | $1,985 | $6,172 |
| 2019 | $754 | $7,769 | $1,662 | $6,107 |
| 2018 | $731 | $7,400 | $1,080 | $6,320 |
| 2017 | $678 | $7,414 | $1,080 | $6,334 |
| 2016 | $658 | $7,062 | $1,080 | $5,982 |
| 2015 | $571 | $7,439 | $569 | $6,870 |
| 2014 | $568 | $7,399 | $569 | $6,830 |
Source: Public Records
Map
Nearby Homes
- 513 Northwest Blvd
- 1323 Hargrove St
- 625 Northwest Ave
- 0 15th Unit 2546881
- 00 N Rockford Rd
- 818 Northwest Blvd
- 1412 Healdton Blvd
- 520 Northwest Ave
- 409 12th Ave NW
- 1228 D St NW
- 1115 Harris St NW
- 413 11th Ave NW
- 1010 Burch St NW
- 505 Campbell St
- 902 Burch St
- 921 D St NW
- 210 15th Ave NW
- 705 10th Ave NW
- 901 Wolverton St
- 811 Hargrove St
- 605 14th Ave NW
- 601 14th Ave NW
- 619 14th Ave NW
- 621 14th Ave NW
- 639 Northwest Blvd
- 1401 Hargrove St
- 630 Northwest Ave
- 691 Northwest Blvd
- 1329 Hargrove St
- 628 Northwest Ave
- 625 14th Ave NW
- 1417 Hargrove St
- 629 Northwest Ave
- 695 Northwest Blvd
- 616 14th Ave NW
- 1327 Hargrove St
- 626 Northwest Ave
- 627 Northwest Ave
- 1421 Hargrove St
- 697 Northwest Blvd