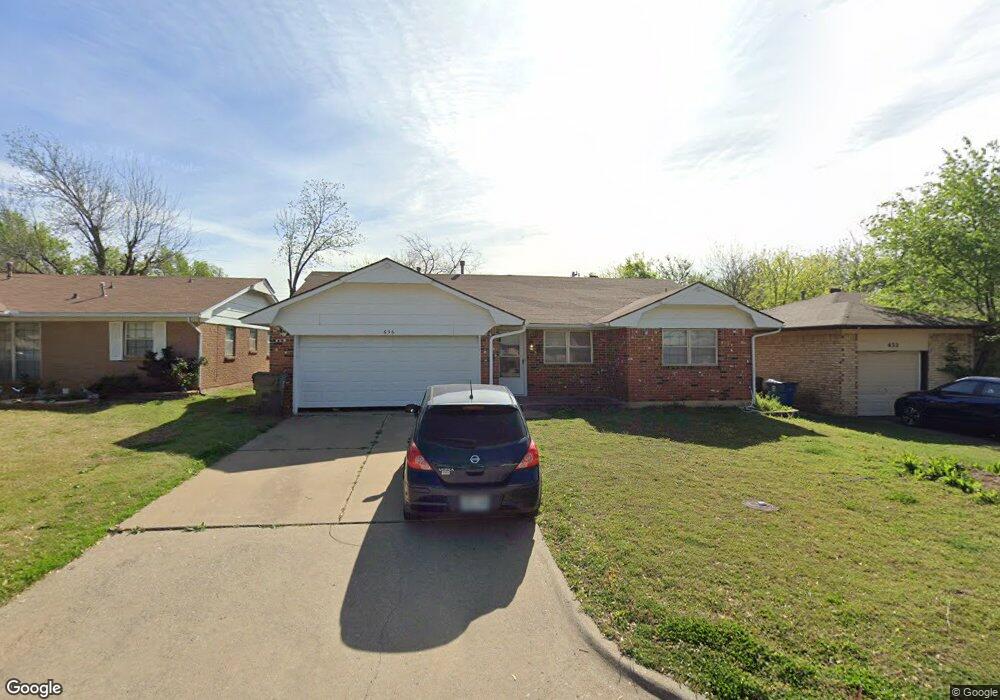
636 Royal Ave Oklahoma City, OK 73130
Estimated Value: $116,000 - $151,000
3
Beds
2
Baths
1,093
Sq Ft
$121/Sq Ft
Est. Value
About This Home
This home is located at 636 Royal Ave, Oklahoma City, OK 73130 and is currently estimated at $132,133, approximately $120 per square foot. 636 Royal Ave is a home located in Oklahoma County with nearby schools including Willow Brook Elementary School, Star Spencer Mid-High School, and Insight School of Oklahoma High School.
Ownership History
Date
Name
Owned For
Owner Type
Purchase Details
Closed on
Dec 22, 2023
Sold by
Walker Billie
Bought by
Rml Home Solutions Llc
Current Estimated Value
Purchase Details
Closed on
Oct 5, 2022
Sold by
Drake Family Rev Living Trust
Bought by
Walker Bobby and Walker Billie
Home Financials for this Owner
Home Financials are based on the most recent Mortgage that was taken out on this home.
Original Mortgage
$64,000
Interest Rate
5.55%
Mortgage Type
New Conventional
Purchase Details
Closed on
Oct 8, 2020
Sold by
Paddock Benjy D and Myron O Paddock Living Trust
Bought by
Drake Family Revocable Living Trust
Purchase Details
Closed on
Dec 7, 2008
Sold by
Paddock Myron O
Bought by
Paddock Myron O and Myron O Paddock Living Trust
Purchase Details
Closed on
Oct 17, 2008
Sold by
Paddock Myron O
Bought by
Paddock Myron O and Myron O Paddock Living Trust
Create a Home Valuation Report for This Property
The Home Valuation Report is an in-depth analysis detailing your home's value as well as a comparison with similar homes in the area
Home Values in the Area
Average Home Value in this Area
Purchase History
| Date | Buyer | Sale Price | Title Company |
|---|---|---|---|
| Rml Home Solutions Llc | $85,000 | Legacy Title Of Oklahoma | |
| Walker Bobby | $80,000 | American Eagle | |
| Drake Family Revocable Living Trust | -- | None Available | |
| Paddock Myron O | -- | None Available | |
| Paddock Myron O | -- | None Available |
Source: Public Records
Mortgage History
| Date | Status | Borrower | Loan Amount |
|---|---|---|---|
| Previous Owner | Walker Bobby | $64,000 |
Source: Public Records
Tax History Compared to Growth
Tax History
| Year | Tax Paid | Tax Assessment Tax Assessment Total Assessment is a certain percentage of the fair market value that is determined by local assessors to be the total taxable value of land and additions on the property. | Land | Improvement |
|---|---|---|---|---|
| 2024 | $1,062 | $13,255 | $1,923 | $11,332 |
| 2023 | $1,062 | $9,185 | $1,923 | $7,262 |
| 2022 | $946 | $8,594 | $1,146 | $7,448 |
| 2021 | $900 | $8,185 | $1,314 | $6,871 |
| 2020 | $865 | $7,796 | $1,337 | $6,459 |
| 2019 | $808 | $7,425 | $1,386 | $6,039 |
| 2018 | $726 | $7,094 | $0 | $0 |
| 2017 | $694 | $6,756 | $1,244 | $5,512 |
| 2016 | $668 | $6,434 | $1,255 | $5,179 |
| 2015 | $682 | $6,284 | $1,255 | $5,029 |
| 2014 | $670 | $6,159 | $1,349 | $4,810 |
Source: Public Records
Map
Nearby Homes
- 609 N Post Rd
- 9816 NE 5th St
- 649 N Juniper Ave
- 640 Moraine Ave
- 708 N Christine Dr
- 1013 N Post Rd
- 9717 NE 10th St
- 709 Briarwood Dr
- 9621 NE 11th St
- 9704 NE 2nd St
- 9604 NE 3rd St
- 203 Oak Tree Ln
- 9228 E Cardinal Place
- 129 Oak Tree Dr
- 1116 N Wilkinson Dr
- 10026 Caton Place
- 121 Saint Charles Way
- 10700 NE 4th St
- 1601 Mcgregor Dr
- 1521 McDonald Dr