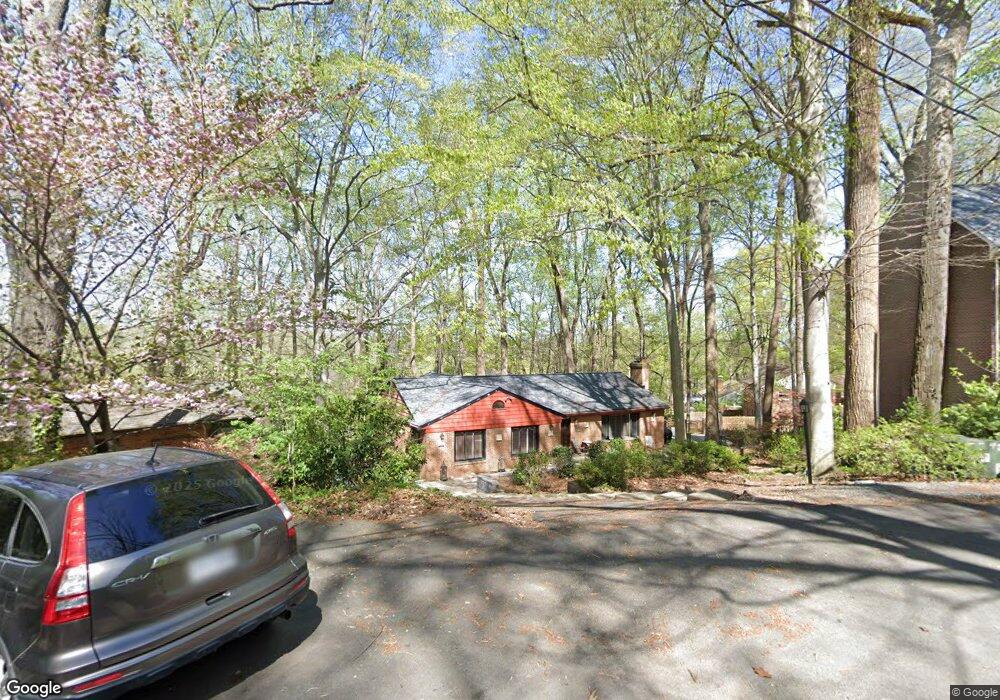
6378 Dockser Terrace Falls Church, VA 22041
Estimated Value: $1,137,000 - $1,287,000
5
Beds
3
Baths
2,000
Sq Ft
$603/Sq Ft
Est. Value
About This Home
This home is located at 6378 Dockser Terrace, Falls Church, VA 22041 and is currently estimated at $1,205,780, approximately $602 per square foot. 6378 Dockser Terrace is a home located in Fairfax County with nearby schools including Belvedere Elementary School, Glasgow Middle School, and Justice High School.
Ownership History
Date
Name
Owned For
Owner Type
Purchase Details
Closed on
Jun 15, 2010
Sold by
Kingsley Daniel T
Bought by
Naquin Jeffrey P
Current Estimated Value
Home Financials for this Owner
Home Financials are based on the most recent Mortgage that was taken out on this home.
Original Mortgage
$722,067
Outstanding Balance
$485,353
Interest Rate
5.03%
Mortgage Type
VA
Estimated Equity
$720,427
Purchase Details
Closed on
Mar 5, 2007
Sold by
Higbee John E
Bought by
Kingsley Daniel T
Home Financials for this Owner
Home Financials are based on the most recent Mortgage that was taken out on this home.
Original Mortgage
$417,000
Interest Rate
6.27%
Mortgage Type
New Conventional
Purchase Details
Closed on
Oct 29, 1998
Sold by
Est Of George J Pastor
Bought by
Higbee John E and Carol A Moody
Home Financials for this Owner
Home Financials are based on the most recent Mortgage that was taken out on this home.
Original Mortgage
$189,000
Interest Rate
6.64%
Create a Home Valuation Report for This Property
The Home Valuation Report is an in-depth analysis detailing your home's value as well as a comparison with similar homes in the area
Home Values in the Area
Average Home Value in this Area
Purchase History
| Date | Buyer | Sale Price | Title Company |
|---|---|---|---|
| Naquin Jeffrey P | $699,000 | -- | |
| Kingsley Daniel T | $720,000 | -- | |
| Higbee John E | $289,000 | -- |
Source: Public Records
Mortgage History
| Date | Status | Borrower | Loan Amount |
|---|---|---|---|
| Open | Naquin Jeffrey P | $722,067 | |
| Previous Owner | Kingsley Daniel T | $417,000 | |
| Previous Owner | Higbee John E | $189,000 |
Source: Public Records
Tax History Compared to Growth
Tax History
| Year | Tax Paid | Tax Assessment Tax Assessment Total Assessment is a certain percentage of the fair market value that is determined by local assessors to be the total taxable value of land and additions on the property. | Land | Improvement |
|---|---|---|---|---|
| 2025 | $14,294 | $1,098,610 | $528,000 | $570,610 |
| 2024 | $14,294 | $1,069,720 | $508,000 | $561,720 |
| 2023 | $13,254 | $1,023,360 | $478,000 | $545,360 |
| 2022 | $12,323 | $933,500 | $448,000 | $485,500 |
| 2021 | $10,948 | $804,380 | $388,000 | $416,380 |
| 2020 | $10,939 | $799,380 | $383,000 | $416,380 |
| 2019 | $10,649 | $776,220 | $368,000 | $408,220 |
| 2018 | $8,663 | $753,330 | $357,000 | $396,330 |
| 2017 | $10,116 | $753,330 | $357,000 | $396,330 |
| 2016 | $10,085 | $753,330 | $357,000 | $396,330 |
| 2015 | $9,397 | $724,090 | $343,000 | $381,090 |
| 2014 | $9,361 | $724,090 | $343,000 | $381,090 |
Source: Public Records
Map
Nearby Homes
- 6430 Maplewood Dr
- 6381 Lakewood Dr
- 6306 Columbia Pike
- 6420 Crosswoods Dr
- 3422 Barger Dr
- 3806 Bent Branch Rd
- 4211 Downing St
- 6222 Beachway Dr
- 4214 Pine Ln
- 3800 Powell Ln Unit 1121
- 3800 Powell Ln Unit 1207
- 3800 Powell Ln Unit 519
- 6478 Woodridge Rd
- 6434 Woodville Dr
- 6323 Everglades Dr
- 6231 Yellowstone Dr
- 3504 Pinetree Terrace
- 3424 Sleepy Hollow Rd
- 3913 Victoria Oaks Trail
- 3245 Rio Dr Unit 901
- 6380 Dockser Terrace
- 6372 Dockser Terrace
- 6374 Dockser Terrace
- 6370 Dockser Terrace
- 6395 Lakeview Dr
- 6401 Lakeview Dr
- 6403 Lakeview Dr
- 6382 Dockser Terrace
- 6405 Lakeview Dr
- 6391 Lakeview Dr
- 6368 Dockser Terrace
- 6384 Dockser Terrace
- 6386 Dockser Terrace
- 6407 Lakeview Dr
- 6371 Dockser Terrace
- 6389 Lakeview Dr
- 6369 Dockser Terrace
- 6388 Dockser Terrace
- 6366 Dockser Terrace
- 6367 Dockser Terrace