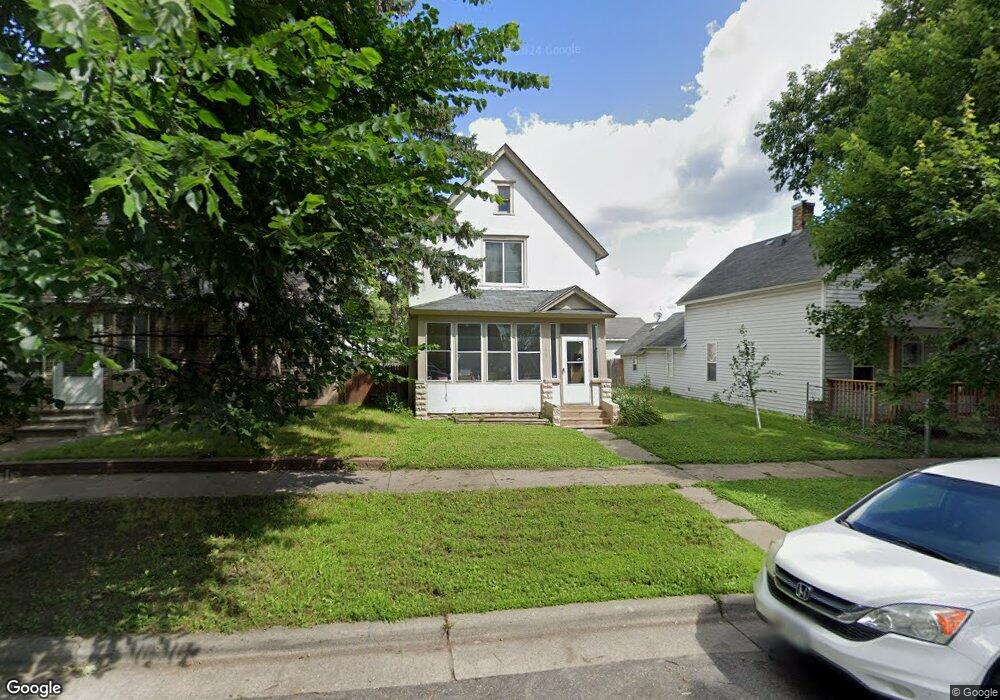
639 Blair Ave Saint Paul, MN 55104
Frogtown NeighborhoodEstimated Value: $211,287 - $235,000
3
Beds
2
Baths
1,700
Sq Ft
$133/Sq Ft
Est. Value
About This Home
This home is located at 639 Blair Ave, Saint Paul, MN 55104 and is currently estimated at $225,322, approximately $132 per square foot. 639 Blair Ave is a home located in Ramsey County with nearby schools including Maxfield Magnet Elementary School, Hidden River Middle School, and Central Senior High School.
Ownership History
Date
Name
Owned For
Owner Type
Purchase Details
Closed on
Oct 22, 2019
Sold by
Jordahl Kyle
Bought by
Scholars Of The Future Llc
Current Estimated Value
Purchase Details
Closed on
Oct 4, 2019
Sold by
Boone Christa and Boone Joseph
Bought by
Jordahl Kyle
Purchase Details
Closed on
Dec 29, 2016
Sold by
Invequity Llc
Bought by
Jordahl Kyle
Home Financials for this Owner
Home Financials are based on the most recent Mortgage that was taken out on this home.
Original Mortgage
$95,550
Interest Rate
3.52%
Mortgage Type
New Conventional
Purchase Details
Closed on
Nov 17, 2016
Sold by
Reynolds Laura L and Faulkner Colin L
Bought by
Invequiuty Llc
Home Financials for this Owner
Home Financials are based on the most recent Mortgage that was taken out on this home.
Original Mortgage
$95,550
Interest Rate
3.52%
Mortgage Type
New Conventional
Create a Home Valuation Report for This Property
The Home Valuation Report is an in-depth analysis detailing your home's value as well as a comparison with similar homes in the area
Home Values in the Area
Average Home Value in this Area
Purchase History
| Date | Buyer | Sale Price | Title Company |
|---|---|---|---|
| Scholars Of The Future Llc | $167,000 | Titlenexus Llc | |
| Jordahl Kyle | -- | Titlenexus Llc | |
| Jordahl Kyle | -- | First American Title Insco | |
| Invequiuty Llc | $77,273 | First American Title |
Source: Public Records
Mortgage History
| Date | Status | Borrower | Loan Amount |
|---|---|---|---|
| Previous Owner | Invequiuty Llc | $95,550 |
Source: Public Records
Tax History Compared to Growth
Tax History
| Year | Tax Paid | Tax Assessment Tax Assessment Total Assessment is a certain percentage of the fair market value that is determined by local assessors to be the total taxable value of land and additions on the property. | Land | Improvement |
|---|---|---|---|---|
| 2025 | $4,192 | $248,500 | $25,000 | $223,500 |
| 2023 | $4,192 | $203,000 | $20,000 | $183,000 |
| 2022 | $3,778 | $195,800 | $20,000 | $175,800 |
| 2021 | $3,332 | $176,900 | $20,000 | $156,900 |
| 2020 | $2,998 | $165,500 | $11,200 | $154,300 |
| 2019 | $2,660 | $137,000 | $11,200 | $125,800 |
| 2018 | $3,300 | $121,700 | $11,200 | $110,500 |
| 2017 | $1,636 | $101,300 | $11,200 | $90,100 |
| 2016 | $1,572 | $0 | $0 | $0 |
| 2015 | $1,688 | $72,400 | $11,200 | $61,200 |
| 2014 | $1,514 | $0 | $0 | $0 |
Source: Public Records
Map
Nearby Homes
- 646 Van Buren Ave
- 653 Thomas Ave
- 631 Van Buren Ave
- 679 Edmund Ave
- 553 Blair Ave
- 547 Blair Ave
- 566 Edmund Ave
- 679 Charles Ave
- 534 Thomas Ave
- 610 Charles Ave
- 751 Van Buren Ave
- 594 Charles Ave
- 730 Edmund Ave
- 511 Van Buren Ave
- 723 Charles Ave
- 639 Sherburne Ave
- 553 Charles Ave
- 538 Charles Ave
- 482 Edmund Ave
- 465 Edmund Ave
- 643 Blair Ave
- 635 Blair Ave
- 631 Blair Ave
- 647 Blair Ave
- 627 Blair Ave
- 651 Blair Ave
- 638 Van Buren Ave
- 634 Van Buren Ave
- 642 Van Buren Ave
- 665 665 Dale-Street-n
- 655 Blair Ave
- 673 Dale St N
- 661 Dale St N
- 650 Van Buren Ave
- 650 650 van Buren Ave
- 638 Blair Ave
- 689 Dale St N
- 642 Blair Ave
- 632 Blair Ave
- 632 Blair Ave Unit 1