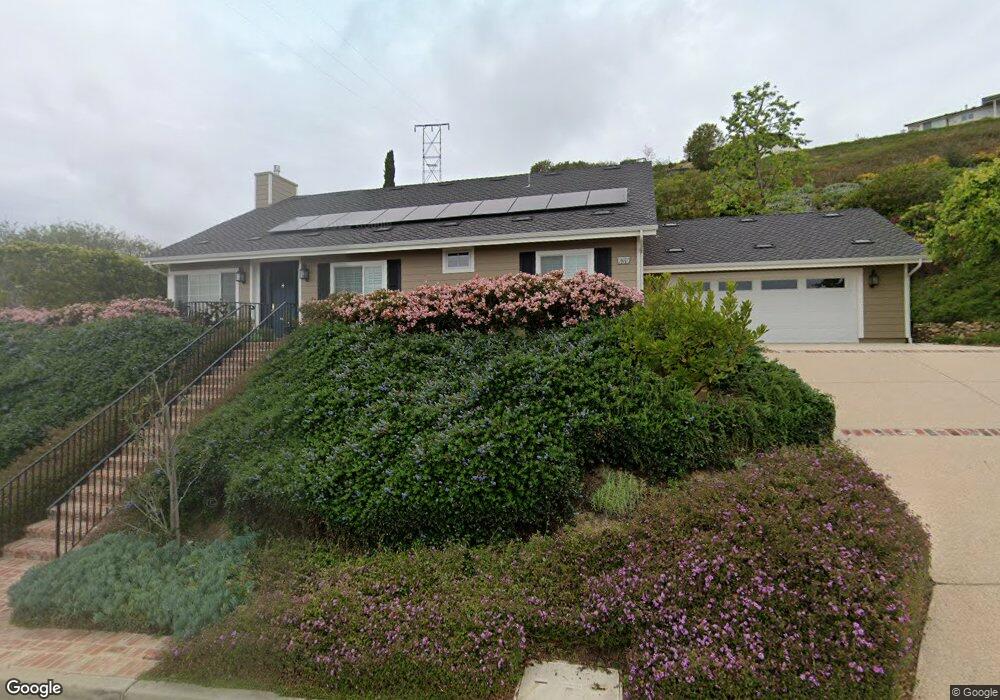
639 Skyview Terrace Ventura, CA 93003
Poinsettia NeighborhoodEstimated Value: $1,259,000 - $1,531,000
3
Beds
3
Baths
2,000
Sq Ft
$676/Sq Ft
Est. Value
About This Home
This home is located at 639 Skyview Terrace, Ventura, CA 93003 and is currently estimated at $1,352,121, approximately $676 per square foot. 639 Skyview Terrace is a home located in Ventura County with nearby schools including Poinsettia Elementary School, Cabrillo Middle School, and Ventura High School.
Ownership History
Date
Name
Owned For
Owner Type
Purchase Details
Closed on
Jul 28, 2020
Sold by
Midgley Jay Darby and Midgley Jean Gose
Bought by
Midgley Family Trust and Midgley
Current Estimated Value
Home Financials for this Owner
Home Financials are based on the most recent Mortgage that was taken out on this home.
Original Mortgage
$175,000
Interest Rate
2.9%
Mortgage Type
New Conventional
Purchase Details
Closed on
Mar 3, 2009
Sold by
Midgley J Darby
Bought by
Midgley Jay Darby and Midgley Jean Barbee
Home Financials for this Owner
Home Financials are based on the most recent Mortgage that was taken out on this home.
Original Mortgage
$116,000
Interest Rate
5.08%
Mortgage Type
Stand Alone Refi Refinance Of Original Loan
Purchase Details
Closed on
May 25, 2000
Sold by
Darby Midgley J and Gose Jean Gose
Bought by
Midgley Jay Darby and Midgley Jean Barbee
Create a Home Valuation Report for This Property
The Home Valuation Report is an in-depth analysis detailing your home's value as well as a comparison with similar homes in the area
Home Values in the Area
Average Home Value in this Area
Purchase History
| Date | Buyer | Sale Price | Title Company |
|---|---|---|---|
| Midgley Family Trust | -- | None Listed On Document | |
| Midgley Jay Darby | -- | None Available | |
| Midgley Jay Darby | -- | Ticor Title Co Of California | |
| Midgley J Darby | -- | Ticor Title Co Of California | |
| Midgley Jay Darby | -- | -- |
Source: Public Records
Mortgage History
| Date | Status | Borrower | Loan Amount |
|---|---|---|---|
| Previous Owner | Midgley Jay Darby | $175,000 | |
| Previous Owner | Midgley J Darby | $116,000 |
Source: Public Records
Tax History Compared to Growth
Tax History
| Year | Tax Paid | Tax Assessment Tax Assessment Total Assessment is a certain percentage of the fair market value that is determined by local assessors to be the total taxable value of land and additions on the property. | Land | Improvement |
|---|---|---|---|---|
| 2025 | $2,410 | $224,851 | $31,813 | $193,038 |
| 2024 | $2,410 | $220,443 | $31,190 | $189,253 |
| 2023 | $2,382 | $216,121 | $30,578 | $185,543 |
| 2022 | $2,184 | $208,684 | $29,979 | $178,705 |
| 2021 | $2,146 | $204,593 | $29,392 | $175,201 |
| 2020 | $450 | $40,513 | $29,091 | $11,422 |
| 2019 | $216 | $21,390 | $21,390 | $0 |
| 2018 | $212 | $20,971 | $20,971 | $0 |
| 2017 | $874 | $81,232 | $27,414 | $53,818 |
| 2016 | $859 | $79,640 | $26,877 | $52,763 |
| 2015 | $845 | $78,445 | $26,474 | $51,971 |
| 2014 | $833 | $76,910 | $25,956 | $50,954 |
Source: Public Records
Map
Nearby Homes
- 708 Skyview Terrace
- 872 Via Arroyo
- 691 Via Ondulando
- 887 Via Ondulando
- 259 Via Pasito
- 1018 Via Arroyo
- 6153 Cobblestone Dr
- 961 Colina Vista
- 6174 Cobblestone Dr
- 978 Colina Vista
- 801 High Point Dr
- 1161 Via Arroyo
- 6005 Sutter St
- 7017 Sonora Ct
- 159 Donner Ave
- 146 Donner Ave
- 91 Mount Whitney Ct
- 1251 Via Cielito
- 5633 Pembroke St
- 5438 Rainier St
- 163 Nob Hill Ln
- 661 Skyview Terrace
- 753 Skyview Terrace
- 638 Skyview Terrace
- 731 Skyview Terrace
- 161 Nob Hill Ln
- 171 Nob Hill Ln
- 769 Skyview Terrace
- 687 Skyview Terrace
- 709 Skyview Terrace
- 696 Via Cielito
- 173 Nob Hill Ln
- 157 Nob Hill Ln
- 791 Skyview Terrace
- 164 Nob Hill Ln
- 768 Skyview Terrace
- 694 Via Cielito
- 752 Skyview Terrace
- 158 Nob Hill Ln
- 172 Nob Hill Ln