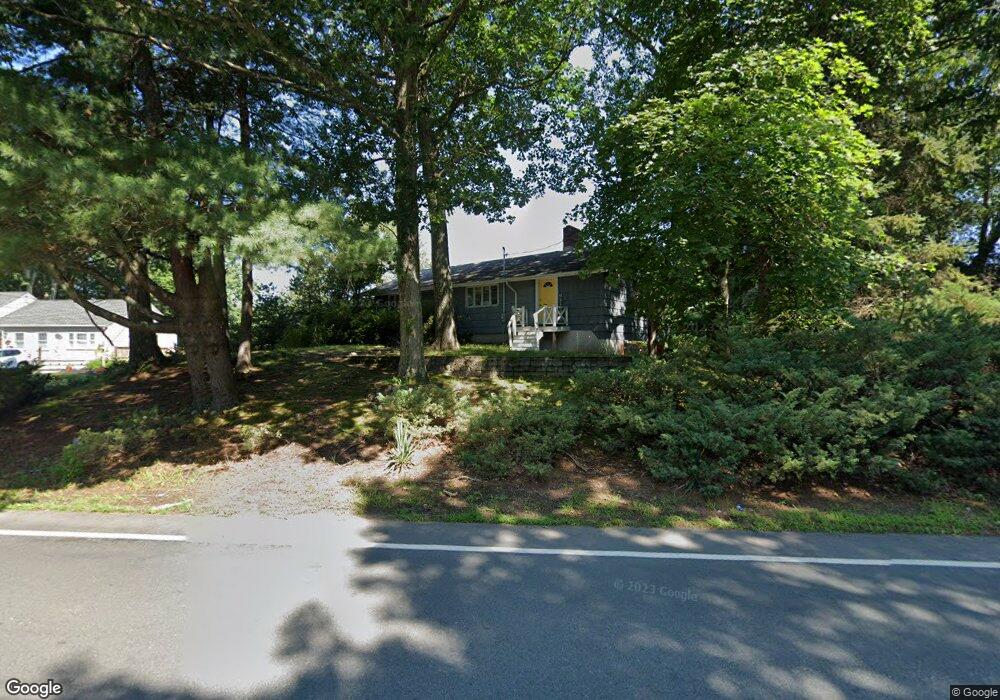
64 Park St Wilmington, MA 01887
Estimated Value: $721,000 - $761,000
3
Beds
2
Baths
1,344
Sq Ft
$547/Sq Ft
Est. Value
About This Home
This home is located at 64 Park St, Wilmington, MA 01887 and is currently estimated at $734,845, approximately $546 per square foot. 64 Park St is a home located in Middlesex County with nearby schools including Wilmington Middle School, Wilmington High School, and N Reading Knowledge Beginnings.
Ownership History
Date
Name
Owned For
Owner Type
Purchase Details
Closed on
Mar 1, 2004
Sold by
Rideout Ivamarie A and Rideout Reid L
Bought by
Churchill Ryan K and Churchill Milissa A
Current Estimated Value
Home Financials for this Owner
Home Financials are based on the most recent Mortgage that was taken out on this home.
Original Mortgage
$272,000
Outstanding Balance
$126,943
Interest Rate
5.65%
Mortgage Type
Purchase Money Mortgage
Estimated Equity
$607,902
Create a Home Valuation Report for This Property
The Home Valuation Report is an in-depth analysis detailing your home's value as well as a comparison with similar homes in the area
Home Values in the Area
Average Home Value in this Area
Purchase History
| Date | Buyer | Sale Price | Title Company |
|---|---|---|---|
| Churchill Ryan K | $340,000 | -- |
Source: Public Records
Mortgage History
| Date | Status | Borrower | Loan Amount |
|---|---|---|---|
| Open | Churchill Ryan K | $272,000 |
Source: Public Records
Tax History Compared to Growth
Tax History
| Year | Tax Paid | Tax Assessment Tax Assessment Total Assessment is a certain percentage of the fair market value that is determined by local assessors to be the total taxable value of land and additions on the property. | Land | Improvement |
|---|---|---|---|---|
| 2025 | $7,029 | $613,900 | $324,600 | $289,300 |
| 2024 | $6,765 | $591,900 | $324,600 | $267,300 |
| 2023 | $6,561 | $549,500 | $295,200 | $254,300 |
| 2022 | $6,232 | $478,300 | $246,000 | $232,300 |
| 2021 | $6,261 | $452,400 | $223,800 | $228,600 |
| 2020 | $6,023 | $443,500 | $223,800 | $219,700 |
| 2019 | $5,987 | $435,400 | $213,000 | $222,400 |
| 2018 | $5,626 | $390,400 | $202,800 | $187,600 |
| 2017 | $5,453 | $377,400 | $202,800 | $174,600 |
| 2016 | $5,229 | $357,400 | $193,200 | $164,200 |
| 2015 | $4,949 | $344,400 | $193,200 | $151,200 |
| 2014 | $4,837 | $339,700 | $184,200 | $155,500 |
Source: Public Records
Map
Nearby Homes
- 3 Gordon Rd
- 220 Martins Landing Unit 309
- 260 Martins Landing Unit 508
- 260 Martins Landing Unit 103
- 200 Martins Landing Unit 102
- 300 Martins Landing Unit 107
- 320 Martins Landing Unit 311
- 320 Martins Landing Unit 108
- 320 Martins Landing Unit 109
- 320 Martins Landing Unit 110
- 320 Martins Landing Unit 303
- 320 Martins Landing Unit 102
- 320 Martins Landing Unit 103
- 320 Martins Landing Unit 2410
- 320 Martins Landing Unit 403
- 320 Martins Landing Unit 107
- 320 Martins Landing Unit 210
- 320 Martins Landing Unit 2201
- 320 Martins Landing Unit 112
- 320 Martins Landing Unit 206