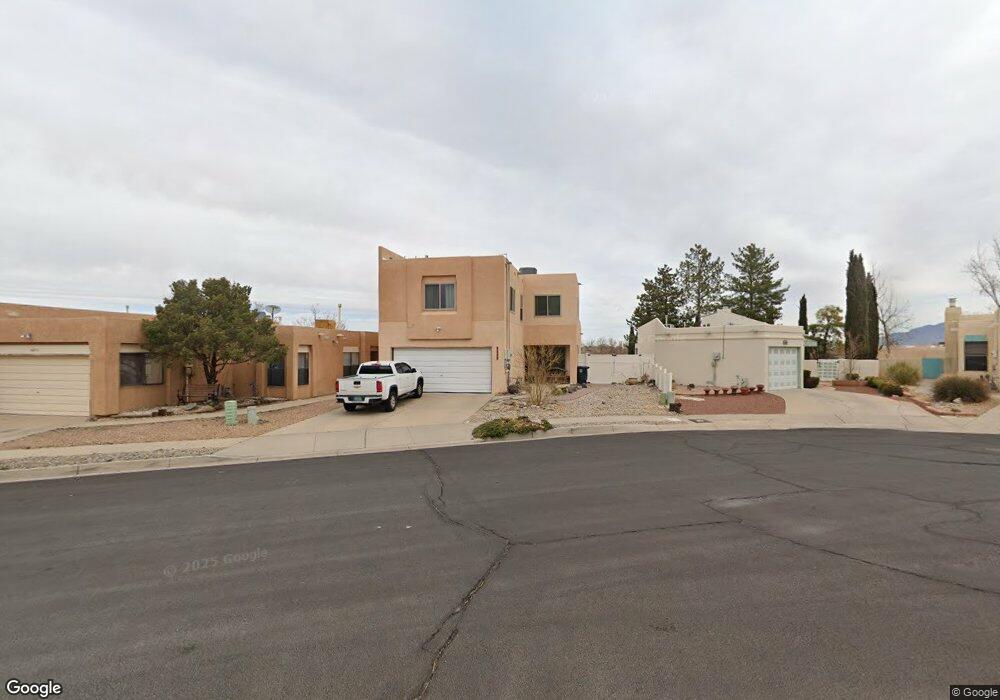
6409 Ja Ct NW Albuquerque, NM 87120
Taylor Ranch NeighborhoodEstimated Value: $323,000 - $354,000
3
Beds
2
Baths
1,578
Sq Ft
$216/Sq Ft
Est. Value
About This Home
This home is located at 6409 Ja Ct NW, Albuquerque, NM 87120 and is currently estimated at $340,333, approximately $215 per square foot. 6409 Ja Ct NW is a home located in Bernalillo County with nearby schools including Chaparral Elementary School, L.B. Johnson Middle School, and Volcano Vista High School.
Ownership History
Date
Name
Owned For
Owner Type
Purchase Details
Closed on
Nov 12, 2013
Sold by
Myers James W E and Padilla Myers Mary G
Bought by
Meyers James W E and Padilla Myers Mary G
Current Estimated Value
Purchase Details
Closed on
Jun 18, 2007
Sold by
Weststar Mortgage Corp
Bought by
Torres Margarita
Purchase Details
Closed on
Apr 18, 2007
Sold by
Myers James William Elton and Padilla Myers Mary G
Bought by
Myers James W E and Padilla Myers Mary G
Purchase Details
Closed on
Oct 23, 2002
Sold by
Hud
Bought by
Barthelemy Michael J and Barthelemy Mary E
Purchase Details
Closed on
Jul 1, 2002
Sold by
Suntrust Mtg Inc
Bought by
Hud
Purchase Details
Closed on
May 23, 2002
Sold by
Tricarico Krista
Bought by
Suntrust Mtg Inc and Crestar Mtg Corp
Purchase Details
Closed on
Nov 24, 1999
Sold by
Arguetta Javier R
Bought by
Argueta Javier and Montoya Auntoinette
Purchase Details
Closed on
Oct 15, 1987
Sold by
Becker George
Bought by
Torres Margarita
Create a Home Valuation Report for This Property
The Home Valuation Report is an in-depth analysis detailing your home's value as well as a comparison with similar homes in the area
Home Values in the Area
Average Home Value in this Area
Purchase History
| Date | Buyer | Sale Price | Title Company |
|---|---|---|---|
| Meyers James W E | -- | None Available | |
| Myers James W E | -- | None Available | |
| Torres Margarita | -- | None Available | |
| Myers James W E | -- | None Available | |
| Barthelemy Michael J | -- | First American Title Ins Co | |
| Hud | -- | First American Title Ins Co | |
| Suntrust Mtg Inc | $82,849 | -- | |
| Argueta Javier | -- | -- | |
| Torres Margarita | -- | None Available |
Source: Public Records
Tax History Compared to Growth
Tax History
| Year | Tax Paid | Tax Assessment Tax Assessment Total Assessment is a certain percentage of the fair market value that is determined by local assessors to be the total taxable value of land and additions on the property. | Land | Improvement |
|---|---|---|---|---|
| 2025 | $3,026 | $77,981 | $11,376 | $66,605 |
| 2024 | $3,026 | $75,710 | $11,045 | $64,665 |
| 2023 | $2,970 | $73,505 | $10,723 | $62,782 |
| 2022 | $2,865 | $71,364 | $10,411 | $60,953 |
| 2021 | $2,764 | $69,286 | $10,108 | $59,178 |
| 2020 | $2,714 | $67,268 | $9,813 | $57,455 |
| 2019 | $2,629 | $65,309 | $9,528 | $55,781 |
| 2018 | $2,531 | $65,309 | $9,528 | $55,781 |
| 2017 | $2,448 | $63,407 | $9,250 | $54,157 |
| 2016 | $2,373 | $59,769 | $8,720 | $51,049 |
| 2015 | $58,028 | $58,028 | $8,466 | $49,562 |
| 2014 | $2,231 | $58,528 | $8,466 | $50,062 |
| 2013 | -- | $58,528 | $8,466 | $50,062 |
Source: Public Records
Map
Nearby Homes
- 6618 Azuelo Ave NW
- 4936 Butte Place NW
- 6615 Astair Ave NW Unit 1
- 6304 Flor Del Sol Place NW
- 0 Unser Blvd NW
- 5909 Storyteller Rd NW
- 6720 Lamar Ave NW
- 6012 Legends Ave NW
- 4904 Rockcress Dr NW
- 6705 Lamar Ave NW
- 5143 Gaviota NW
- 5101 Tecolote NW
- 5129 Camino Vista NW
- 5504 Hayes Dr NW
- 6133 Flor de Mayo Place NW
- 6005 Rio Pueblo Dr NW
- 4532 67th St NW
- 5805 Chimayo Dr NW
- 5901 Chimayo Dr NW
- 5905 Los Riscos Rd NW
- 6415 Ja Ct NW
- 6405 Ja Ct NW
- 6417 Ja Ct NW
- 6401 Ja Ct NW
- 6400 Ja Ct NW
- 6504 Conrad Ave NW
- 6421 Ja Ct NW
- 6500 Conrad Ave NW
- 6508 Conrad Ave NW
- 6425 Ja Ct NW
- 6412 Ja Ct NW
- 6404 Ja Ct NW
- 6416 Ja Ct NW
- 6512 Conrad Ave NW
- 6516 Conrad Ave NW
- 4900 Bogart St NW Unit A
- 4900 Bogart St NW Unit C
- 4900 Bogart St NW Unit B
- 4900 Bogart St NW
- 4900 Bogart St NW Unit B