
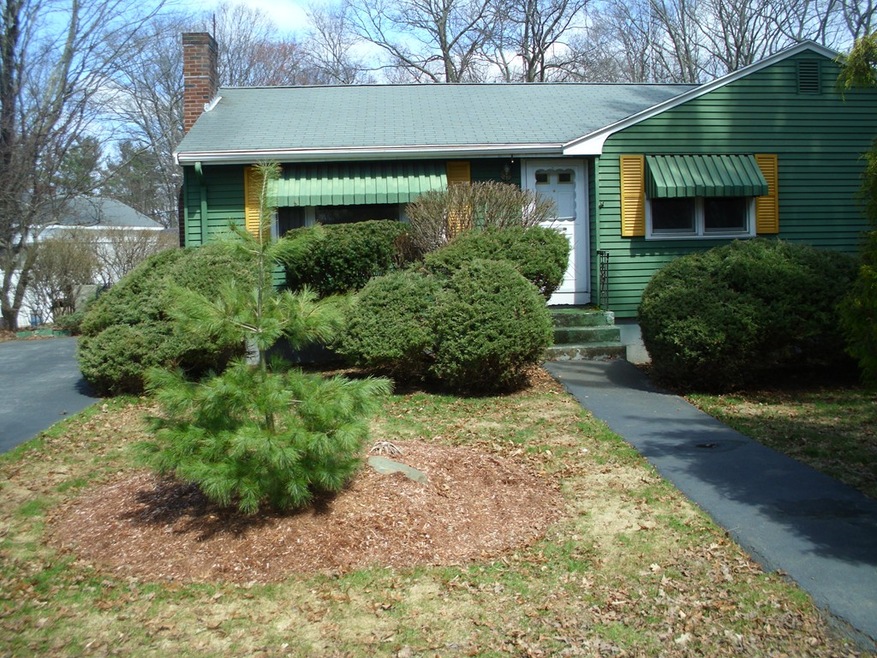
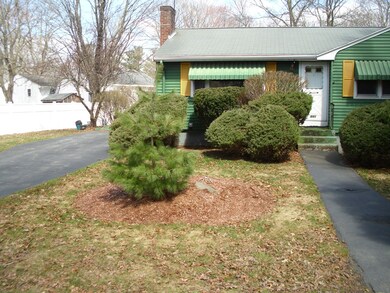
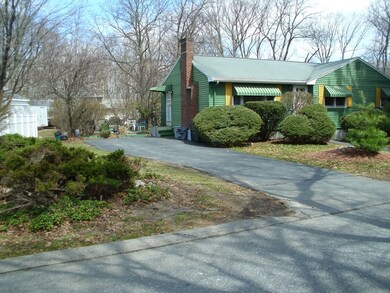
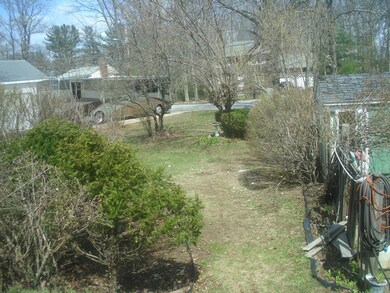
641 Elm St Marlborough, MA 01752
3
Beds
1
Bath
1,030
Sq Ft
0.32
Acres
About This Home
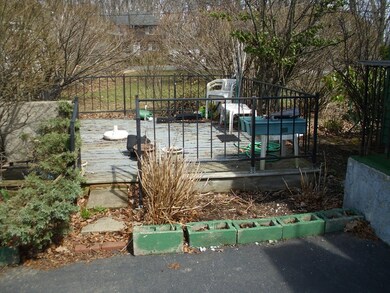
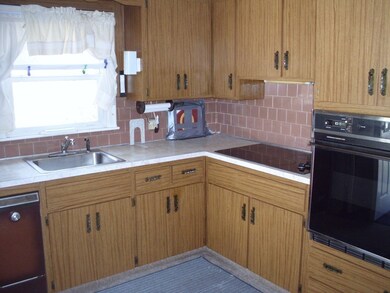
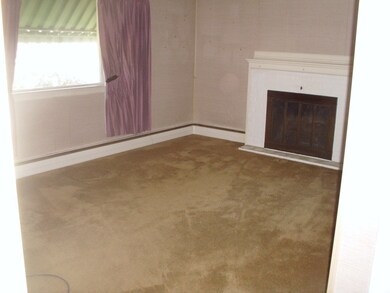
As of September 2024Affordable ranch in the City Of Marlborough. Handy first time buyers don't miss out on this one. This house will sell fast. Three bedroom house in need of updates. House is being sold AS/IS. Seller to review any and all offers on April 28, 2018.
Home Details
Home Type
- Single Family
Est. Annual Taxes
- $5,187
Year Built
- Built in 1959
Lot Details
- Year Round Access
Flooring
- Plywood
- Wall to Wall Carpet
- Laminate
Utilities
- Window Unit Cooling System
- Hot Water Baseboard Heater
- Heating System Uses Oil
- Oil Water Heater
- Cable TV Available
Additional Features
- Basement
Listing and Financial Details
- Assessor Parcel Number M:066 B:042 L:000
Ownership History
Date
Name
Owned For
Owner Type
Purchase Details
Listed on
Nov 14, 2018
Closed on
Mar 11, 2019
Sold by
Harpin George
Bought by
Gee Dustin L and Cabal Alexander
Seller's Agent
Team Metrowest
Berkshire Hathaway HomeServices Commonwealth Real Estate
Buyer's Agent
Ryan Wilson
Keller Williams Realty
List Price
$425,000
Sold Price
$398,600
Premium/Discount to List
-$26,400
-6.21%
Current Estimated Value
Home Financials for this Owner
Home Financials are based on the most recent Mortgage that was taken out on this home.
Estimated Appreciation
$232,934
Avg. Annual Appreciation
7.63%
Original Mortgage
$386,642
Interest Rate
4.4%
Mortgage Type
New Conventional
Purchase Details
Listed on
Apr 20, 2018
Closed on
May 25, 2018
Sold by
Barkley E Millsaps Ret
Bought by
Harpin George
Seller's Agent
Scott King
Bridge Realty
Buyer's Agent
Team Metrowest
Berkshire Hathaway HomeServices Commonwealth Real Estate
List Price
$269,900
Sold Price
$285,000
Premium/Discount to List
$15,100
5.59%
Home Financials for this Owner
Home Financials are based on the most recent Mortgage that was taken out on this home.
Avg. Annual Appreciation
50.55%
Purchase Details
Closed on
Jun 15, 2015
Sold by
Millsaps Barkley E
Bought by
Barkley E Millsaps Ret
Similar Homes in Marlborough, MA
Create a Home Valuation Report for This Property
The Home Valuation Report is an in-depth analysis detailing your home's value as well as a comparison with similar homes in the area
Home Values in the Area
Average Home Value in this Area
Purchase History
| Date | Type | Sale Price | Title Company |
|---|---|---|---|
| Not Resolvable | $398,600 | -- | |
| Not Resolvable | $285,000 | -- | |
| Deed | -- | -- | |
| Deed | -- | -- |
Source: Public Records
Mortgage History
| Date | Status | Loan Amount | Loan Type |
|---|---|---|---|
| Open | $567,000 | Purchase Money Mortgage | |
| Closed | $567,000 | Purchase Money Mortgage | |
| Closed | $381,050 | Stand Alone Refi Refinance Of Original Loan | |
| Closed | $384,660 | Stand Alone Refi Refinance Of Original Loan | |
| Closed | $386,642 | New Conventional |
Source: Public Records
Property History
| Date | Event | Price | Change | Sq Ft Price |
|---|---|---|---|---|
| 09/26/2024 09/26/24 | Sold | $630,000 | +8.8% | $400 / Sq Ft |
| 08/19/2024 08/19/24 | Pending | -- | -- | -- |
| 08/13/2024 08/13/24 | For Sale | $579,000 | +45.3% | $368 / Sq Ft |
| 03/19/2019 03/19/19 | Sold | $398,600 | +0.3% | $248 / Sq Ft |
| 02/10/2019 02/10/19 | Pending | -- | -- | -- |
| 01/16/2019 01/16/19 | Price Changed | $397,500 | -0.6% | $247 / Sq Ft |
| 12/10/2018 12/10/18 | Price Changed | $399,900 | -3.6% | $249 / Sq Ft |
| 11/29/2018 11/29/18 | Price Changed | $415,000 | -2.4% | $258 / Sq Ft |
| 11/14/2018 11/14/18 | For Sale | $425,000 | +49.1% | $264 / Sq Ft |
| 05/25/2018 05/25/18 | Sold | $285,000 | +5.6% | $277 / Sq Ft |
| 04/28/2018 04/28/18 | Pending | -- | -- | -- |
| 04/20/2018 04/20/18 | For Sale | $269,900 | -- | $262 / Sq Ft |
Source: MLS Property Information Network (MLS PIN)
Tax History Compared to Growth
Tax History
| Year | Tax Paid | Tax Assessment Tax Assessment Total Assessment is a certain percentage of the fair market value that is determined by local assessors to be the total taxable value of land and additions on the property. | Land | Improvement |
|---|---|---|---|---|
| 2025 | $5,187 | $526,100 | $213,300 | $312,800 |
| 2024 | $5,252 | $512,900 | $193,800 | $319,100 |
| 2023 | $5,625 | $487,400 | $156,500 | $330,900 |
| 2022 | $5,417 | $412,900 | $149,000 | $263,900 |
| 2021 | $5,521 | $400,100 | $121,400 | $278,700 |
| 2020 | $4,886 | $344,600 | $118,300 | $226,300 |
| 2019 | $4,113 | $292,300 | $115,900 | $176,400 |
| 2018 | $3,782 | $258,500 | $96,200 | $162,300 |
| 2017 | $3,493 | $228,000 | $94,500 | $133,500 |
| 2016 | $3,347 | $218,200 | $94,500 | $123,700 |
| 2015 | -- | $204,500 | $96,900 | $107,600 |
Source: Public Records
Agents Affiliated with this Home
-
Ryan Wilson
Seller's Agent in 2024
Ryan Wilson
Keller Williams Realty
(781) 424-6286
674 Total Sales
-
Patrick Hopkins
Seller Co-Listing Agent in 2024
Patrick Hopkins
Keller Williams Realty
(781) 799-6842
20 Total Sales
-
Lyn Gorka
Buyer's Agent in 2024
Lyn Gorka
RE/MAX
(508) 481-6787
102 Total Sales
-
Team Metrowest
Seller's Agent in 2019
Team Metrowest
Berkshire Hathaway HomeServices Commonwealth Real Estate
(508) 223-7583
213 Total Sales
-
Scott King
S
Seller's Agent in 2018
Scott King
Bridge Realty
27 Total Sales
Map
Source: MLS Property Information Network (MLS PIN)
MLS Number: 72312402
APN: MARL-000066-000042
Disclaimer: Certain information contained herein is derived from information provided by parties other than Homes.com. All information provided is deemed reliable, but is not guaranteed to be accurate and should be independently verified.
![]() The property listing data and information, or the Images, set forth herein were provided to MLS Property Information Network, Inc. from third party sources, including sellers, lessors and public records, and were compiled by MLS Property Information Network, Inc. The property listing data and information, and the Images, are for the personal, non-commercial use of consumers having a good faith interest in purchasing or leasing listed properties of the type displayed to them and may not be used for any purpose other than to identify prospective properties which such consumers may have a good faith interest in purchasing or leasing. MLS Property Information Network, Inc. and its subscribers disclaim any and all representations and warranties as to the accuracy of the property listing data and information, or as to the accuracy of any of the Images, set forth herein.
The property listing data and information, or the Images, set forth herein were provided to MLS Property Information Network, Inc. from third party sources, including sellers, lessors and public records, and were compiled by MLS Property Information Network, Inc. The property listing data and information, and the Images, are for the personal, non-commercial use of consumers having a good faith interest in purchasing or leasing listed properties of the type displayed to them and may not be used for any purpose other than to identify prospective properties which such consumers may have a good faith interest in purchasing or leasing. MLS Property Information Network, Inc. and its subscribers disclaim any and all representations and warranties as to the accuracy of the property listing data and information, or as to the accuracy of any of the Images, set forth herein.
Nearby Homes