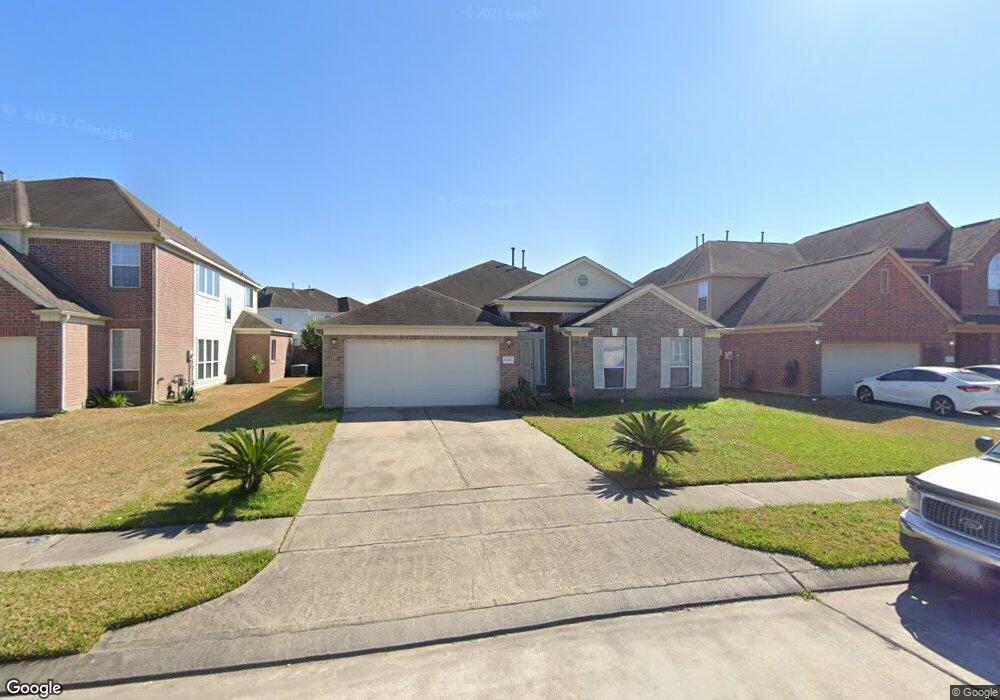
6414 Hardwood Dale Way Dr Humble, TX 77338
Estimated Value: $256,000 - $292,000
4
Beds
2
Baths
2,319
Sq Ft
$117/Sq Ft
Est. Value
About This Home
This home is located at 6414 Hardwood Dale Way Dr, Humble, TX 77338 and is currently estimated at $271,372, approximately $117 per square foot. 6414 Hardwood Dale Way Dr is a home located in Harris County with nearby schools including Cypresswood Elementary School, Jones Middle, and Nimitz Ninth Grade School.
Ownership History
Date
Name
Owned For
Owner Type
Purchase Details
Closed on
Apr 21, 2014
Sold by
Secretary Of Hud
Bought by
Nguyen Cindy
Current Estimated Value
Home Financials for this Owner
Home Financials are based on the most recent Mortgage that was taken out on this home.
Original Mortgage
$93,600
Outstanding Balance
$71,394
Interest Rate
4.43%
Mortgage Type
New Conventional
Estimated Equity
$199,978
Purchase Details
Closed on
Sep 18, 2013
Sold by
Ocwen Loan Servicing Llc
Bought by
The Secretary Of Hud
Purchase Details
Closed on
Aug 6, 2013
Sold by
Parvin Leslie Gene and Parvin Tina
Bought by
Ocwen Loan Servicing Llc
Purchase Details
Closed on
Jul 16, 2009
Sold by
Long Lake Ltd
Bought by
Parvin Leslie Gene
Home Financials for this Owner
Home Financials are based on the most recent Mortgage that was taken out on this home.
Original Mortgage
$138,698
Interest Rate
5.39%
Mortgage Type
FHA
Create a Home Valuation Report for This Property
The Home Valuation Report is an in-depth analysis detailing your home's value as well as a comparison with similar homes in the area
Home Values in the Area
Average Home Value in this Area
Purchase History
| Date | Buyer | Sale Price | Title Company |
|---|---|---|---|
| Nguyen Cindy | -- | Chicago Title | |
| The Secretary Of Hud | -- | None Available | |
| Ocwen Loan Servicing Llc | $95,450 | None Available | |
| Parvin Leslie Gene | -- | American Title Company |
Source: Public Records
Mortgage History
| Date | Status | Borrower | Loan Amount |
|---|---|---|---|
| Open | Nguyen Cindy | $93,600 | |
| Previous Owner | Parvin Leslie Gene | $138,698 |
Source: Public Records
Tax History Compared to Growth
Tax History
| Year | Tax Paid | Tax Assessment Tax Assessment Total Assessment is a certain percentage of the fair market value that is determined by local assessors to be the total taxable value of land and additions on the property. | Land | Improvement |
|---|---|---|---|---|
| 2025 | $6,281 | $268,697 | $57,389 | $211,308 |
| 2024 | $6,281 | $251,438 | $46,229 | $205,209 |
| 2023 | $6,281 | $284,042 | $46,229 | $237,813 |
| 2022 | $6,728 | $248,000 | $36,984 | $211,016 |
| 2021 | $6,075 | $219,043 | $36,984 | $182,059 |
| 2020 | $5,801 | $199,590 | $36,984 | $162,606 |
| 2019 | $5,798 | $191,658 | $36,984 | $154,674 |
| 2018 | $2,513 | $175,000 | $36,984 | $138,016 |
| 2017 | $5,211 | $178,091 | $36,984 | $141,107 |
| 2016 | $3,804 | $130,000 | $15,942 | $114,058 |
| 2015 | $3,595 | $130,000 | $15,942 | $114,058 |
| 2014 | $3,595 | $117,000 | $15,942 | $101,058 |
Source: Public Records
Map
Nearby Homes
- 20623 Falling Cypress Ct
- 20510 Wren Hollow Way
- 20702 Dappled Ridge Way
- 6747 Old Cypress Landing Ln
- 6614 Early Fall Dr
- 6030 Patriot Sound Rd
- 5927 Patriot Sound Dr
- 6003 Patriot Sound Dr
- 5938 Patriot Sound Dr
- 5814 Patriot Sound Dr
- 5806 Dr
- 5934 Patriot Sound Dr
- 5810 Patriot Sound Dr
- 5815 Patriot Sound Dr
- 6034 Patriot Sound Dr
- 5930 Patriot Sound Dr
- 5922 Patriot Sound Dr
- 5811 Patriot Sound Dr
- 5818 Dr
- 6010 Patriot Sound Dr
- 6414 Hardwood Dale Way
- 6418 Hardwood Dale Way
- 6410 Hardwood Dale Way
- 6410 Hardwood Dale Way Dr
- 20706 Ibis Pond Ln
- 6422 Hardwood Dale Way
- 6415 Early Fall Dr
- 6419 Early Fall Dr
- 20702 Ibis Pond Ln
- 6415 Hardwood Dale Way
- 6426 Hardwood Dale Way
- 6419 Hardwood Dale Way
- 6411 Hardwood Dale Way
- 6411 Early Fall Dr
- 6423 Hardwood Dale Way
- 20715 Ibis Pond Ln
- 20719 Ibis Pond Ln
- 20618 Ibis Pond Ln
- 6407 Hardwood Dale Way
- 20711 Ibis Pond Ln