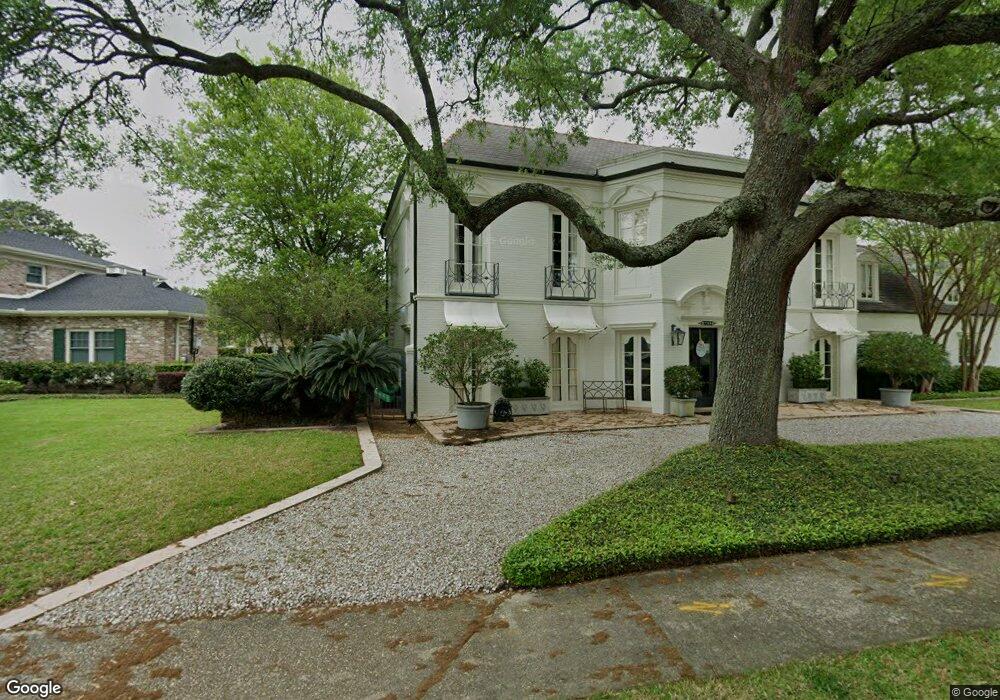
6443 Paris Ave New Orleans, LA 70122
Lake Terrace-Oaks NeighborhoodEstimated Value: $783,000 - $893,000
4
Beds
4
Baths
4,805
Sq Ft
$174/Sq Ft
Est. Value
About This Home
This home is located at 6443 Paris Ave, New Orleans, LA 70122 and is currently estimated at $834,205, approximately $173 per square foot. 6443 Paris Ave is a home located in Orleans Parish with nearby schools including Pierre A. Capdau Charter School, Mary Bethune Elementary School, and Edward Hynes Charter School - Uno Campus.
Ownership History
Date
Name
Owned For
Owner Type
Purchase Details
Closed on
Dec 23, 2022
Sold by
Badar Rami W
Bought by
Bader Morton W
Current Estimated Value
Purchase Details
Closed on
Jun 24, 2019
Sold by
Bordenave Tonya Washington and Bordenave Jeffrey J
Bought by
Badr Rami V
Home Financials for this Owner
Home Financials are based on the most recent Mortgage that was taken out on this home.
Original Mortgage
$640,000
Interest Rate
4%
Mortgage Type
Adjustable Rate Mortgage/ARM
Purchase Details
Closed on
Jul 22, 2016
Sold by
Vergona Louis and Vergona Colleen
Bought by
Bordenave Jeffrey and Bordenave Tonya
Home Financials for this Owner
Home Financials are based on the most recent Mortgage that was taken out on this home.
Original Mortgage
$600,000
Interest Rate
3.6%
Mortgage Type
Adjustable Rate Mortgage/ARM
Create a Home Valuation Report for This Property
The Home Valuation Report is an in-depth analysis detailing your home's value as well as a comparison with similar homes in the area
Home Values in the Area
Average Home Value in this Area
Purchase History
| Date | Buyer | Sale Price | Title Company |
|---|---|---|---|
| Bader Morton W | -- | -- | |
| Badr Rami V | $800,000 | Nola Living Title Llc | |
| Bordenave Jeffrey | $820,750 | Delta Title Corporation |
Source: Public Records
Mortgage History
| Date | Status | Borrower | Loan Amount |
|---|---|---|---|
| Previous Owner | Badr Rami V | $640,000 | |
| Previous Owner | Bordenave Jeffrey | $600,000 |
Source: Public Records
Tax History Compared to Growth
Tax History
| Year | Tax Paid | Tax Assessment Tax Assessment Total Assessment is a certain percentage of the fair market value that is determined by local assessors to be the total taxable value of land and additions on the property. | Land | Improvement |
|---|---|---|---|---|
| 2025 | $9,868 | $72,110 | $30,380 | $41,730 |
| 2024 | $9,962 | $72,110 | $30,380 | $41,730 |
| 2023 | $8,747 | $72,000 | $30,380 | $41,620 |
| 2022 | $8,747 | $60,030 | $30,380 | $29,650 |
| 2021 | $10,664 | $72,000 | $30,380 | $41,620 |
| 2020 | $11,930 | $80,000 | $30,380 | $49,620 |
| 2019 | $13,151 | $91,920 | $30,380 | $61,540 |
| 2018 | $13,405 | $91,920 | $30,380 | $61,540 |
| 2017 | $13,823 | $91,920 | $30,380 | $61,540 |
| 2016 | $5,360 | $40,320 | $19,450 | $20,870 |
| 2015 | $5,258 | $40,320 | $19,450 | $20,870 |
| 2014 | -- | $40,320 | $19,450 | $20,870 |
| 2013 | -- | $40,320 | $19,450 | $20,870 |
Source: Public Records
Map
Nearby Homes
- 6417 Paris Ave
- 6425 Paris Ave
- 6411 Paris Ave
- 6418 Caldwell Dr
- 6412 Caldwell Dr
- 6424 Caldwell Dr
- 6433 Paris Ave
- 6420 Paris Ave
- 6408 Caldwell Dr
- 6410 Paris Ave
- 6401 Paris Ave
- 6428 Paris Ave
- 6417 Bertha Dr
- 6423 Caldwell Dr
- 6415 Caldwell Dr
- 1600 Oriole St
- 6400 Caldwell Dr
- 6400 Paris Ave
- 6409 Caldwell Dr
- 1516 Lakeshore Dr