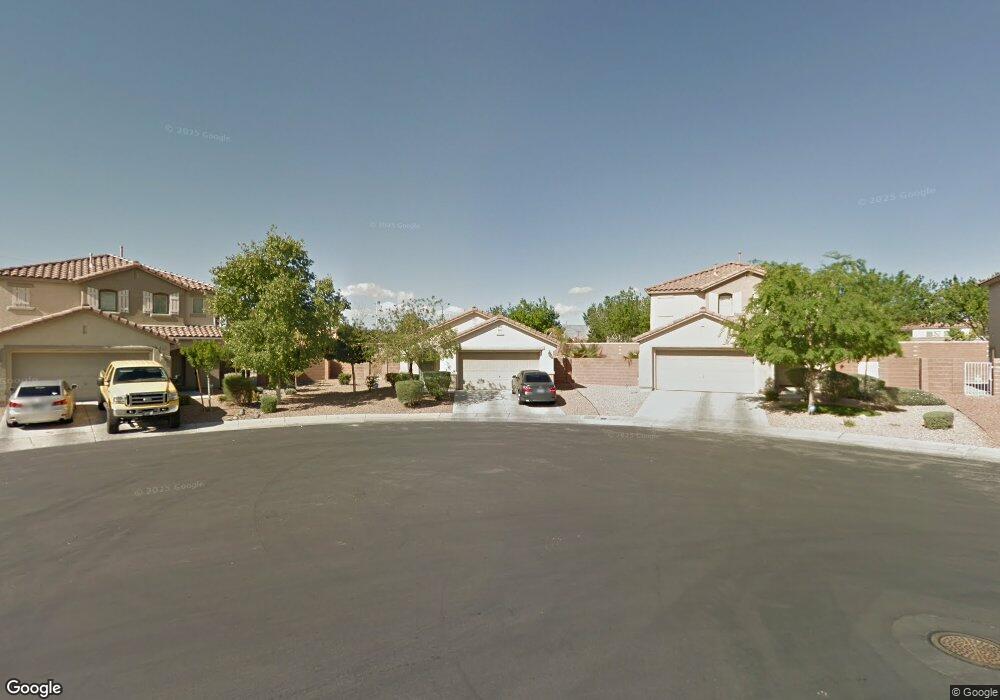
6445 Cape Petrel St North Las Vegas, NV 89084
Aliante NeighborhoodEstimated Value: $354,000 - $383,723
3
Beds
2
Baths
1,235
Sq Ft
$304/Sq Ft
Est. Value
About This Home
This home is located at 6445 Cape Petrel St, North Las Vegas, NV 89084 and is currently estimated at $375,181, approximately $303 per square foot. 6445 Cape Petrel St is a home located in Clark County with nearby schools including Goynes Elementary School, Brian & Teri Cram Middle School, and Legacy High School.
Ownership History
Date
Name
Owned For
Owner Type
Purchase Details
Closed on
Jul 27, 2016
Sold by
Cousin Deberah
Bought by
Cousin Deberah Jo and The Debrah Jo Cousin Reocable Living Tru
Current Estimated Value
Purchase Details
Closed on
Mar 25, 2011
Sold by
Laris Laris Linda
Bought by
Cousin Deberah
Home Financials for this Owner
Home Financials are based on the most recent Mortgage that was taken out on this home.
Original Mortgage
$84,794
Outstanding Balance
$58,152
Interest Rate
4.75%
Mortgage Type
FHA
Estimated Equity
$317,029
Purchase Details
Closed on
Aug 21, 2008
Sold by
Deutsche Bank Trust Co Americas
Bought by
Laris Laris Linda
Home Financials for this Owner
Home Financials are based on the most recent Mortgage that was taken out on this home.
Original Mortgage
$168,547
Interest Rate
6.27%
Mortgage Type
VA
Purchase Details
Closed on
May 17, 2008
Sold by
Richards Byron Lynn
Bought by
Deutsche Bank Trust Co Americas and Equifirst Mtg Loan Rust 2005-1
Purchase Details
Closed on
Mar 9, 2006
Sold by
Richards Byron
Bought by
Richards Byron L and Richards Kristee J
Home Financials for this Owner
Home Financials are based on the most recent Mortgage that was taken out on this home.
Original Mortgage
$26,150
Interest Rate
6.35%
Mortgage Type
Credit Line Revolving
Purchase Details
Closed on
Jan 27, 2005
Sold by
Lee Trent C
Bought by
Lee Chad
Home Financials for this Owner
Home Financials are based on the most recent Mortgage that was taken out on this home.
Original Mortgage
$266,000
Interest Rate
7.2%
Mortgage Type
Unknown
Purchase Details
Closed on
Jan 18, 2005
Sold by
Lee Trent
Bought by
Lee Chad
Home Financials for this Owner
Home Financials are based on the most recent Mortgage that was taken out on this home.
Original Mortgage
$266,000
Interest Rate
7.2%
Mortgage Type
Unknown
Purchase Details
Closed on
Jan 14, 2005
Sold by
Richards Kristee
Bought by
Richards Byron Lynn
Home Financials for this Owner
Home Financials are based on the most recent Mortgage that was taken out on this home.
Original Mortgage
$266,000
Interest Rate
7.2%
Mortgage Type
Unknown
Purchase Details
Closed on
Nov 19, 2003
Sold by
Kb Home Nevada Inc
Bought by
Lee Trent C and Lee Sesily A
Home Financials for this Owner
Home Financials are based on the most recent Mortgage that was taken out on this home.
Original Mortgage
$137,000
Interest Rate
4.87%
Mortgage Type
Unknown
Create a Home Valuation Report for This Property
The Home Valuation Report is an in-depth analysis detailing your home's value as well as a comparison with similar homes in the area
Home Values in the Area
Average Home Value in this Area
Purchase History
| Date | Buyer | Sale Price | Title Company |
|---|---|---|---|
| Cousin Deberah Jo | -- | None Available | |
| Cousin Deberah | $87,000 | Ticor Title Las Vegas | |
| Laris Laris Linda | $165,000 | Ticor Title Las Vegas | |
| Deutsche Bank Trust Co Americas | $141,950 | Fidelity National | |
| Richards Byron L | -- | None Available | |
| Lee Chad | -- | Chicago Title | |
| Lee Trent C | -- | Chicago Title | |
| Lee Chad | $171,000 | -- | |
| Lee Trent | $171,000 | -- | |
| Richards Byron Lynn | -- | Chicago Title | |
| Richards Byron Lynn | $204,500 | Chicago Title | |
| Lee Chad | -- | Chicago Title | |
| Lee Trent C | $171,311 | First American Title Co Of |
Source: Public Records
Mortgage History
| Date | Status | Borrower | Loan Amount |
|---|---|---|---|
| Open | Cousin Deberah | $84,794 | |
| Previous Owner | Laris Laris Linda | $168,547 | |
| Previous Owner | Richards Byron L | $26,150 | |
| Previous Owner | Richards Byron Lynn | $266,000 | |
| Previous Owner | Lee Trent C | $137,000 | |
| Closed | Lee Trent C | $34,250 |
Source: Public Records
Tax History Compared to Growth
Tax History
| Year | Tax Paid | Tax Assessment Tax Assessment Total Assessment is a certain percentage of the fair market value that is determined by local assessors to be the total taxable value of land and additions on the property. | Land | Improvement |
|---|---|---|---|---|
| 2025 | $1,716 | $94,765 | $33,600 | $61,165 |
| 2024 | $1,589 | $94,765 | $33,600 | $61,165 |
| 2023 | $1,589 | $91,303 | $33,600 | $57,703 |
| 2022 | $1,472 | $78,639 | $25,900 | $52,739 |
| 2021 | $1,363 | $73,436 | $25,200 | $48,236 |
| 2020 | $1,206 | $70,238 | $22,400 | $47,838 |
| 2019 | $1,130 | $69,116 | $22,050 | $47,066 |
| 2018 | $1,079 | $62,656 | $17,325 | $45,331 |
| 2017 | $1,981 | $59,068 | $17,325 | $41,743 |
| 2016 | $1,011 | $48,614 | $11,550 | $37,064 |
| 2015 | $1,008 | $35,832 | $8,750 | $27,082 |
| 2014 | $978 | $28,296 | $7,000 | $21,296 |
Source: Public Records
Map
Nearby Homes
- 6527 Copper Smith Ct
- 6424 Grayback Dr
- 6528 Chebec St
- 2420 Mountain Rail Dr
- 6703 Tufted Duck Way
- 3221 Villa Pisani Ct
- 2265 Stone Breeze Ave
- 3225 Villa Pisani Ct
- 2305 Dalton Ridge Ct
- 2120 Marsh Tern Ct
- 2261 Dalton Ridge Ct
- 6140 Passionate Ct
- 2265 Dixon Springs Ave
- 6712 Tattler Dr
- 2312 Scissortail Ct
- 2109 Silvereye Dr
- 3217 Palladio Ave
- 6420 Indian Peak Ct
- 6437 Boatbill St
- 6417 Giant Oak St
- 2825 Cedar Bird Dr
- 6449 Cape Petrel St
- 2821 Cedar Bird Dr
- 2821 Cedar Bird Dr Unit n/a
- 6453 Cape Petrel St
- 6505 Cape Petrel St
- 2817 Cedar Bird Dr
- 6504 Cape Petrel St
- 2813 Cedar Bird Dr
- 6509 Cape Petrel St
- 6508 Cape Petrel St
- 2809 Cedar Bird Dr
- 2809 Cedar Bird Dr Unit HOME
- 6513 Cape Petrel St
- 6513 Cape Petrel St Unit none
- 6504 Greenlet Ave
- 6512 Cape Petrel St
- 2805 Cedar Bird Dr
- 6517 Cape Petrel St
- 6508 Greenlet Ave