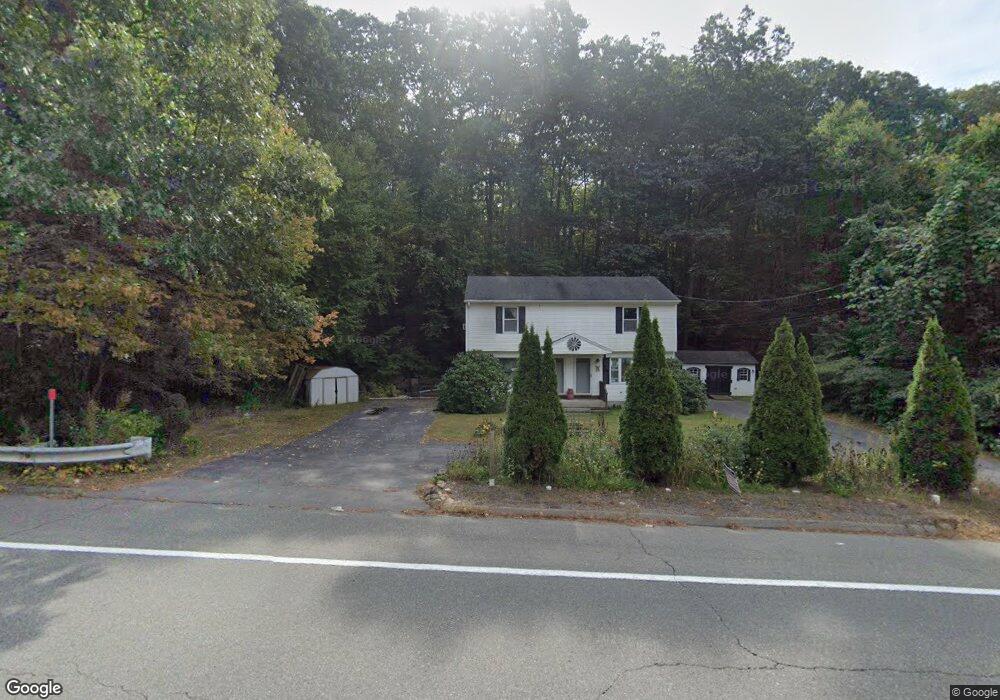
645 Main St Warren, MA 01083
Estimated Value: $275,000 - $387,000
4
Beds
2
Baths
1,764
Sq Ft
$176/Sq Ft
Est. Value
About This Home
This home is located at 645 Main St, Warren, MA 01083 and is currently estimated at $310,961, approximately $176 per square foot. 645 Main St is a home with nearby schools including Quaboag Regional High School.
Ownership History
Date
Name
Owned For
Owner Type
Purchase Details
Closed on
Dec 13, 2002
Sold by
Leomon&Lemon Land Dev
Bought by
Edwards Jeffrey F and Carvalho Andrea K
Current Estimated Value
Home Financials for this Owner
Home Financials are based on the most recent Mortgage that was taken out on this home.
Original Mortgage
$112,423
Outstanding Balance
$47,167
Interest Rate
6.17%
Mortgage Type
Purchase Money Mortgage
Estimated Equity
$263,794
Create a Home Valuation Report for This Property
The Home Valuation Report is an in-depth analysis detailing your home's value as well as a comparison with similar homes in the area
Home Values in the Area
Average Home Value in this Area
Purchase History
| Date | Buyer | Sale Price | Title Company |
|---|---|---|---|
| Edwards Jeffrey F | $115,900 | -- |
Source: Public Records
Mortgage History
| Date | Status | Borrower | Loan Amount |
|---|---|---|---|
| Open | Edwards Jeffrey F | $112,423 |
Source: Public Records
Tax History Compared to Growth
Tax History
| Year | Tax Paid | Tax Assessment Tax Assessment Total Assessment is a certain percentage of the fair market value that is determined by local assessors to be the total taxable value of land and additions on the property. | Land | Improvement |
|---|---|---|---|---|
| 2025 | $2,962 | $200,000 | $45,700 | $154,300 |
| 2024 | $3,014 | $200,000 | $45,700 | $154,300 |
| 2023 | $2,945 | $186,400 | $45,700 | $140,700 |
| 2022 | $2,597 | $166,900 | $39,300 | $127,600 |
| 2021 | $5,189 | $156,300 | $37,100 | $119,200 |
| 2020 | $9,240 | $147,600 | $37,100 | $110,500 |
| 2019 | $6,085 | $140,500 | $37,100 | $103,400 |
| 2018 | $8,165 | $136,200 | $37,100 | $99,100 |
| 2017 | $2,454 | $132,200 | $38,600 | $93,600 |
| 2016 | $2,510 | $126,500 | $36,700 | $89,800 |
| 2015 | $2,372 | $126,500 | $36,700 | $89,800 |
| 2014 | $2,456 | $128,600 | $36,700 | $91,900 |
Source: Public Records
Map
Nearby Homes
- 29 Liberty St
- Lot 8 Southbridge Rd
- LOT 7 Southbridge Rd
- 124 Southbridge Rd
- 152 Southbridge Rd Unit 3D
- 35 Bacon St
- 58 Nelson St
- Lot 4 Brimfield Rd
- 82 Comins Pond Rd
- 17 Otis St
- 72 Maple St
- 366 Southbridge Rd
- 59 High St
- 170 Bridge St
- 940 Old West Brookfield Rd
- 920 Old West Brookfield Rd
- Lot 5 Brimfield Rd
- Lot 3 Brimfield Rd
- Lot 2 Brimfield Rd
- Lot 1 Brimfield Rd