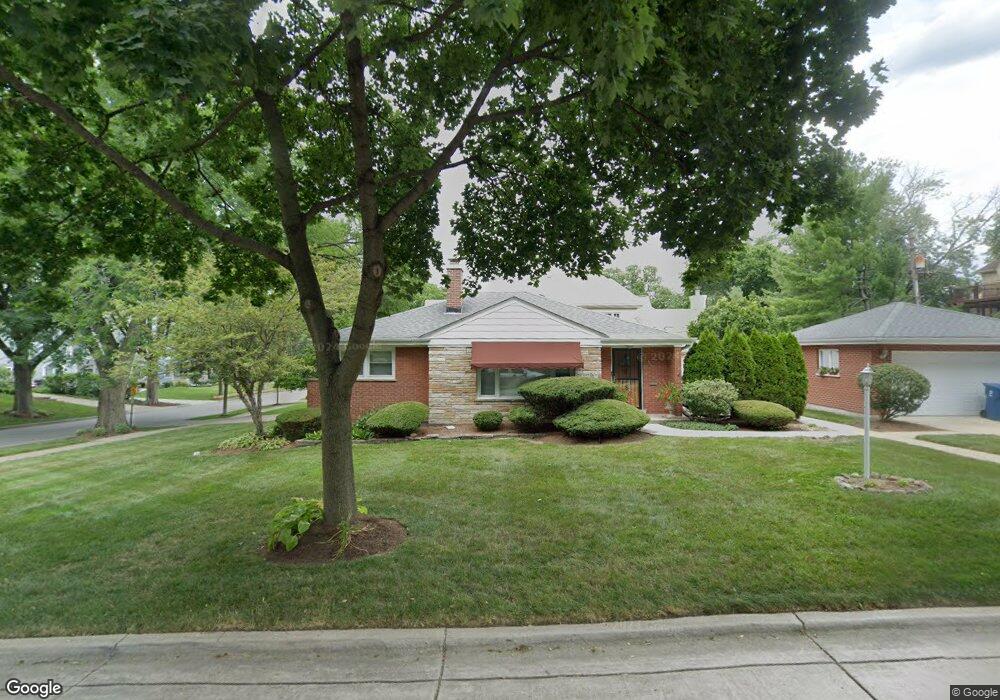
645 S Stough St Hinsdale, IL 60521
South Hinsdale NeighborhoodEstimated Value: $605,000 - $734,000
--
Bed
--
Bath
1,214
Sq Ft
$538/Sq Ft
Est. Value
About This Home
This home is located at 645 S Stough St, Hinsdale, IL 60521 and is currently estimated at $653,058, approximately $537 per square foot. 645 S Stough St is a home located in DuPage County with nearby schools including Madison Elementary School, Hinsdale Middle School, and Hinsdale Central High School.
Ownership History
Date
Name
Owned For
Owner Type
Purchase Details
Closed on
Sep 30, 1998
Sold by
Tenjak Martha
Bought by
Petrus Miles and Petras Petroula
Current Estimated Value
Home Financials for this Owner
Home Financials are based on the most recent Mortgage that was taken out on this home.
Original Mortgage
$75,000
Outstanding Balance
$16,520
Interest Rate
6.97%
Estimated Equity
$636,538
Create a Home Valuation Report for This Property
The Home Valuation Report is an in-depth analysis detailing your home's value as well as a comparison with similar homes in the area
Home Values in the Area
Average Home Value in this Area
Purchase History
| Date | Buyer | Sale Price | Title Company |
|---|---|---|---|
| Petrus Miles | $250,000 | Premier Title Company |
Source: Public Records
Mortgage History
| Date | Status | Borrower | Loan Amount |
|---|---|---|---|
| Open | Petrus Miles | $75,000 |
Source: Public Records
Tax History Compared to Growth
Tax History
| Year | Tax Paid | Tax Assessment Tax Assessment Total Assessment is a certain percentage of the fair market value that is determined by local assessors to be the total taxable value of land and additions on the property. | Land | Improvement |
|---|---|---|---|---|
| 2024 | $9,228 | $186,003 | $85,164 | $100,839 |
| 2023 | $8,754 | $170,990 | $78,290 | $92,700 |
| 2022 | $8,731 | $172,530 | $79,000 | $93,530 |
| 2021 | $8,411 | $170,570 | $78,100 | $92,470 |
| 2020 | $8,217 | $167,190 | $76,550 | $90,640 |
| 2019 | $8,215 | $160,420 | $73,450 | $86,970 |
| 2018 | $7,369 | $149,580 | $73,050 | $76,530 |
| 2017 | $7,094 | $143,930 | $70,290 | $73,640 |
| 2016 | $6,950 | $137,360 | $67,080 | $70,280 |
| 2015 | $6,907 | $129,230 | $63,110 | $66,120 |
| 2014 | $6,492 | $117,750 | $61,360 | $56,390 |
| 2013 | $6,364 | $117,200 | $61,070 | $56,130 |
Source: Public Records
Map
Nearby Homes
- 608 S Quincy St
- 722 S Bruner St
- 438 S Quincy St
- 626 S Bodin St
- 544 W 7th St
- 530 W 6th St
- 203 Grant Ave
- 264 Holmes Ave
- 928 S Monroe St
- 29 Waverly Ave
- 5524 S Bruner St
- 102 S Quincy St
- 5545 S Stough St
- 213 Walker Ave
- 216 S Madison St
- 221 Burlington Ave Unit 1
- 443 S Clay St
- 21 S Bruner St
- 5513 Barclay Ct Unit 36
- 217 55th St
- 641 S Stough St
- 635 S Stough St
- 805 W 7th St
- 703 S Stough St
- 642 S Quincy St
- 631 S Stough St
- 636 S Quincy St
- 800 W 7th St
- 833 W 7th St
- 709 S Stough St
- 640 S Stough St
- 702 S Stough St
- 632 S Quincy St
- 636 S Stough St
- 625 S Stough St
- 710 S Quincy St
- 708 S Stough St
- 713 S Stough St
- 632 S Stough St
- 626 S Quincy St