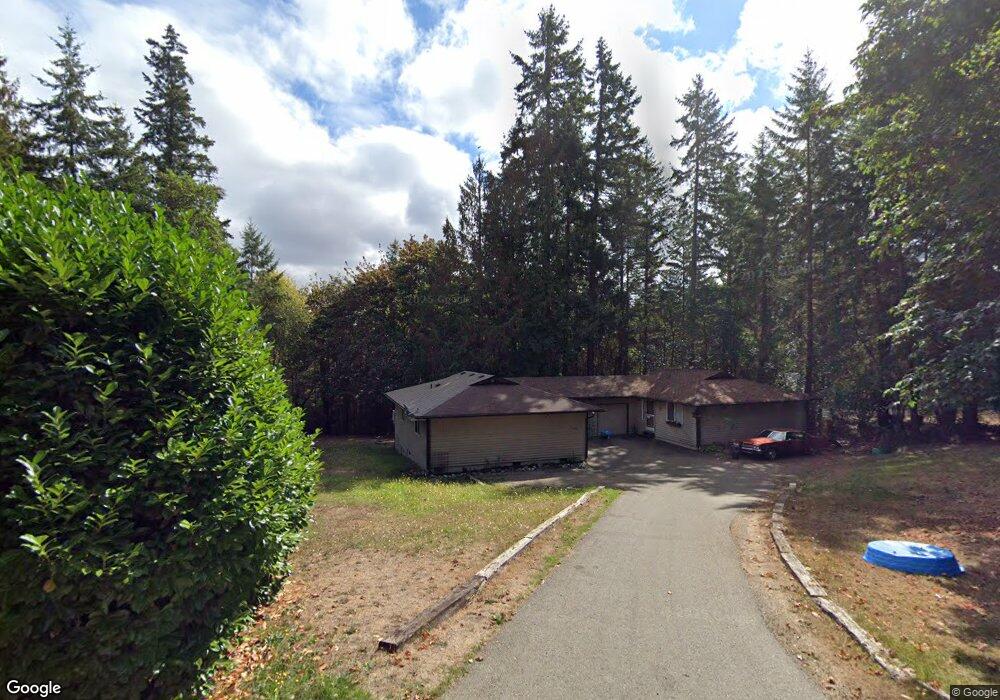
6451 Lewis Dr NE Bremerton, WA 98311
Estimated Value: $514,000 - $528,000
2
Beds
2
Baths
2,016
Sq Ft
$258/Sq Ft
Est. Value
About This Home
This home is located at 6451 Lewis Dr NE, Bremerton, WA 98311 and is currently estimated at $520,667, approximately $258 per square foot. 6451 Lewis Dr NE is a home located in Kitsap County with nearby schools including Brownsville Elementary School, Ridgetop Middle School, and Olympic High School.
Ownership History
Date
Name
Owned For
Owner Type
Purchase Details
Closed on
Mar 1, 2010
Sold by
Rodgers Nicholas Sean and Stumpo Albert D
Bought by
Rodgers Nicholas Sean
Current Estimated Value
Home Financials for this Owner
Home Financials are based on the most recent Mortgage that was taken out on this home.
Original Mortgage
$173,000
Interest Rate
4.88%
Mortgage Type
New Conventional
Purchase Details
Closed on
Jun 26, 2008
Sold by
Walden Piper Properties Llc
Bought by
Rick Schultz Construction Inc
Home Financials for this Owner
Home Financials are based on the most recent Mortgage that was taken out on this home.
Original Mortgage
$400,000
Interest Rate
6.04%
Mortgage Type
Construction
Purchase Details
Closed on
Oct 1, 1997
Sold by
Schedlin Barbara
Bought by
Stumpo Albert D
Home Financials for this Owner
Home Financials are based on the most recent Mortgage that was taken out on this home.
Original Mortgage
$114,000
Interest Rate
7.54%
Create a Home Valuation Report for This Property
The Home Valuation Report is an in-depth analysis detailing your home's value as well as a comparison with similar homes in the area
Home Values in the Area
Average Home Value in this Area
Purchase History
| Date | Buyer | Sale Price | Title Company |
|---|---|---|---|
| Rodgers Nicholas Sean | -- | Accommodation | |
| Rick Schultz Construction Inc | $150,280 | Stewart Title | |
| Stumpo Albert D | $130,000 | Pacific Northwest Title |
Source: Public Records
Mortgage History
| Date | Status | Borrower | Loan Amount |
|---|---|---|---|
| Closed | Rodgers Nicholas Sean | $173,000 | |
| Previous Owner | Rick Schultz Construction Inc | $400,000 | |
| Previous Owner | Stumpo Albert D | $114,000 |
Source: Public Records
Tax History Compared to Growth
Tax History
| Year | Tax Paid | Tax Assessment Tax Assessment Total Assessment is a certain percentage of the fair market value that is determined by local assessors to be the total taxable value of land and additions on the property. | Land | Improvement |
|---|---|---|---|---|
| 2026 | $3,961 | $405,380 | $131,160 | $274,220 |
| 2025 | $3,961 | $405,380 | $131,160 | $274,220 |
| 2024 | $3,853 | $405,380 | $131,160 | $274,220 |
| 2023 | $3,862 | $405,380 | $131,160 | $274,220 |
| 2022 | $3,630 | $335,220 | $108,400 | $226,820 |
| 2021 | $3,028 | $263,690 | $81,300 | $182,390 |
| 2020 | $2,838 | $249,840 | $76,720 | $173,120 |
| 2019 | $2,649 | $225,390 | $69,270 | $156,120 |
| 2018 | $2,818 | $187,090 | $57,250 | $129,840 |
| 2017 | $2,504 | $187,090 | $57,250 | $129,840 |
| 2016 | $2,418 | $167,050 | $51,120 | $115,930 |
| 2015 | $2,516 | $182,620 | $56,620 | $126,000 |
| 2014 | -- | $174,900 | $56,620 | $118,280 |
| 2013 | -- | $174,900 | $56,620 | $118,280 |
Source: Public Records
Map
Nearby Homes
- 3840 NE Ambleside Ln
- 3744 NE Trout Brook Ln
- 6305 Rest Place NE
- 4005 NE Derek Dr
- 3532 NE Shore Cliff St
- 3 Illahee Rd NE
- 3380 NE 3rd St N Unit 29
- 3703 NE Trout Brook Ln
- 3709 NE Liverpool Dr
- 3060 NE Mcwilliams Rd Unit 104
- 3060 NE Mcwilliams Rd Unit 9
- 5503 Fern Ave NE
- 2940 Osiris Ct NE
- 0 University Point Cir NE
- 7550 Varsity Ln NE
- 6371 Illahee Rd NE
- 5208 Illahee Rd NE
- 3000 NE Loyola St
- 2348 NE Windsor Ct
- 4808 Charmont Ln NE
- 6449 Lewis Dr NE
- 6463 Lewis Dr NE
- 6462 Lewis Dr NE
- 3725 NE Clark St
- 3715 NE Clark St
- 6481 Illahee Rd NE
- 6385 East Blvd NE
- 3695 NE Clark St
- 6473 Illahee Rd NE
- 6485 Lewis Dr NE
- 6485 Illahee Rd NE
- 3710 NE Clark St
- 3720 NE Clark St
- 6505 Lewis Dr NE
- 6542 Lewis Dr NE
- 6362 East Blvd NE
- 6404 East Blvd NE
- 6469 Illahee Rd NE
- 3887 NE 3rd St N
- 3725 NE 3rd St N