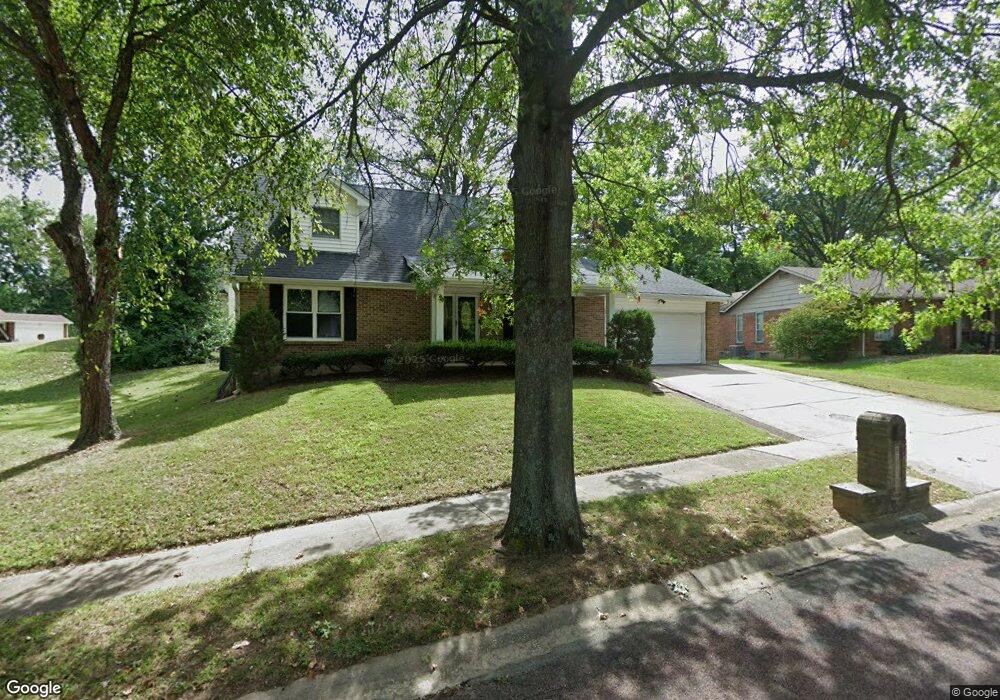
6468 Lake Paddock Dr Florissant, MO 63033
Estimated Value: $240,100 - $260,000
4
Beds
3
Baths
1,950
Sq Ft
$129/Sq Ft
Est. Value
About This Home
This home is located at 6468 Lake Paddock Dr, Florissant, MO 63033 and is currently estimated at $251,525, approximately $128 per square foot. 6468 Lake Paddock Dr is a home located in St. Louis County with nearby schools including Townsend Elementary School, Central Middle School, and Hazelwood Central High School.
Ownership History
Date
Name
Owned For
Owner Type
Purchase Details
Closed on
Jul 27, 2005
Sold by
Wagner Debora L and Leach Gregg A
Bought by
Durham Columbus E
Current Estimated Value
Home Financials for this Owner
Home Financials are based on the most recent Mortgage that was taken out on this home.
Original Mortgage
$173,328
Outstanding Balance
$89,601
Interest Rate
5.51%
Mortgage Type
VA
Estimated Equity
$161,924
Purchase Details
Closed on
May 29, 2003
Sold by
Smith Jeffrey Raymond
Bought by
Leach Gregg A and Wagner Deborah L
Home Financials for this Owner
Home Financials are based on the most recent Mortgage that was taken out on this home.
Original Mortgage
$110,000
Interest Rate
5.74%
Mortgage Type
Purchase Money Mortgage
Purchase Details
Closed on
Jul 10, 1998
Sold by
Davis Larry H
Bought by
Smith Jeffrey Raymond
Home Financials for this Owner
Home Financials are based on the most recent Mortgage that was taken out on this home.
Original Mortgage
$98,100
Interest Rate
6.87%
Mortgage Type
Assumption
Create a Home Valuation Report for This Property
The Home Valuation Report is an in-depth analysis detailing your home's value as well as a comparison with similar homes in the area
Home Values in the Area
Average Home Value in this Area
Purchase History
| Date | Buyer | Sale Price | Title Company |
|---|---|---|---|
| Durham Columbus E | $173,328 | Usa Title Llc | |
| Leach Gregg A | $160,000 | -- | |
| Smith Jeffrey Raymond | -- | -- |
Source: Public Records
Mortgage History
| Date | Status | Borrower | Loan Amount |
|---|---|---|---|
| Open | Durham Columbus E | $173,328 | |
| Previous Owner | Leach Gregg A | $110,000 | |
| Previous Owner | Smith Jeffrey Raymond | $98,100 |
Source: Public Records
Tax History Compared to Growth
Tax History
| Year | Tax Paid | Tax Assessment Tax Assessment Total Assessment is a certain percentage of the fair market value that is determined by local assessors to be the total taxable value of land and additions on the property. | Land | Improvement |
|---|---|---|---|---|
| 2025 | $3,555 | $42,230 | $3,720 | $38,510 |
| 2024 | $3,555 | $39,110 | $2,910 | $36,200 |
| 2023 | $3,543 | $39,110 | $2,910 | $36,200 |
| 2022 | $3,156 | $30,970 | $6,460 | $24,510 |
| 2021 | $2,987 | $30,970 | $6,460 | $24,510 |
| 2020 | $3,005 | $29,030 | $5,660 | $23,370 |
| 2019 | $2,957 | $29,030 | $5,660 | $23,370 |
| 2018 | $2,516 | $22,800 | $3,250 | $19,550 |
| 2017 | $2,513 | $22,800 | $3,250 | $19,550 |
| 2016 | $2,554 | $22,800 | $2,910 | $19,890 |
| 2015 | $2,975 | $27,230 | $2,910 | $24,320 |
| 2014 | $2,651 | $24,130 | $3,530 | $20,600 |
Source: Public Records
Map
Nearby Homes
- 6480 Hadden Bay Dr
- 6320 Hadden Bay Dr
- 12320 Missile Ln
- 6587 Dolphin Cir E Unit 110B
- 6595 Dolphin Cir E Unit 131A
- 6250 Pennyrich Ct
- 12136 La Padera Ln
- 12225 Tarpon Dr
- 6470 White Cap Ln Unit D
- 12750 Needle Point Ct
- 12095 El Camara Dr
- 12455 Jerries Ln
- 12292 Jerries Ln
- 12705 Stubwood Dr
- 12065 El Camara Dr
- 12435 Sea Lane Dr Unit 5
- 12456 Sea Lane Dr Unit A
- 5432 Trailbend Dr
- 11760 Sheffield Dr
- 5348 Trailoaks Dr
- 6458 Lake Paddock Dr
- 6473 Tide Water Dr
- 6478 Lake Paddock Dr
- 6443 Tide Water Dr
- 6457 Lake Paddock Dr
- 6438 Lake Paddock Dr
- 6433 Tide Water Dr
- 6447 Lake Paddock Ct
- 6423 Tide Water Dr
- 6418 Lake Paddock Dr
- 6444 Tide Water Dr
- 6454 Tide Water Dr
- 6464 Tide Water Dr
- 6470 Hadden Bay Dr
- 6474 Tide Water Dr
- 6437 Lake Paddock Ct
- 6413 Tide Water Dr
- 6484 Tide Water Dr
- 12465 Rocket Dr
- 6398 Lake Paddock Dr