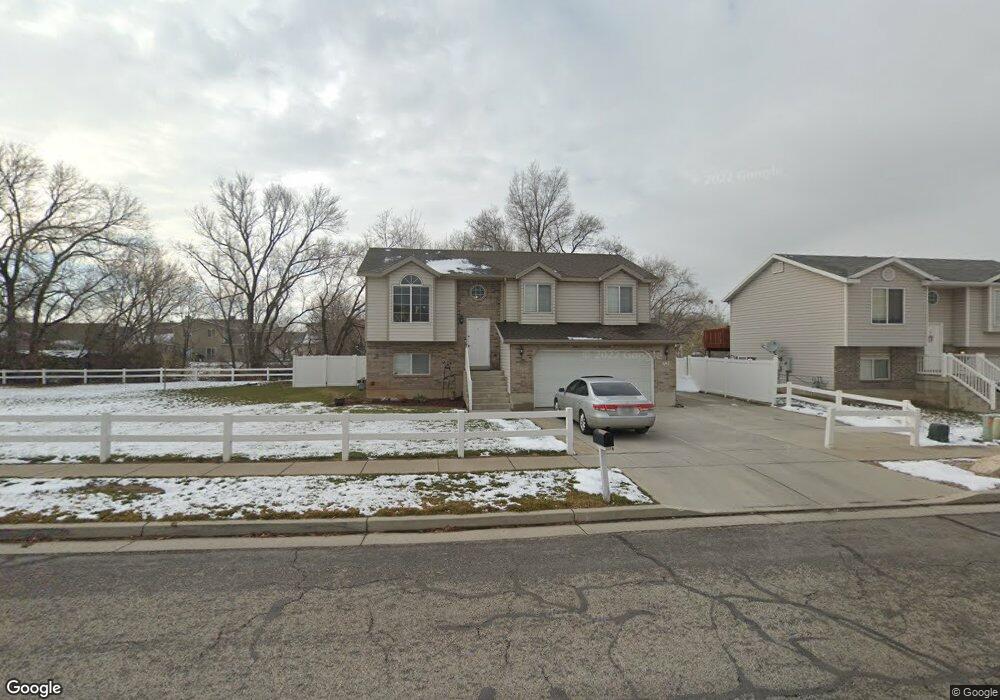
647 S 375 W Unit 1 Ogden, UT 84404
Lynn NeighborhoodEstimated Value: $404,000 - $450,162
4
Beds
2
Baths
1,820
Sq Ft
$234/Sq Ft
Est. Value
About This Home
This home is located at 647 S 375 W Unit 1, Ogden, UT 84404 and is currently estimated at $425,541, approximately $233 per square foot. 647 S 375 W Unit 1 is a home located in Weber County with nearby schools including Heritage Elementary School, Highland Junior High School, and Ben Lomond High School.
Ownership History
Date
Name
Owned For
Owner Type
Purchase Details
Closed on
Aug 5, 2015
Sold by
Provence John K and Provence Patricia N
Bought by
The John & Patricia Provence Living Tr and Provence John K
Current Estimated Value
Purchase Details
Closed on
Aug 21, 2003
Sold by
Mike Schultz Construction Inc
Bought by
Provence John K and Provence Patricia N
Home Financials for this Owner
Home Financials are based on the most recent Mortgage that was taken out on this home.
Original Mortgage
$123,045
Outstanding Balance
$53,552
Interest Rate
5.46%
Mortgage Type
Purchase Money Mortgage
Estimated Equity
$371,989
Purchase Details
Closed on
Apr 28, 2003
Sold by
Mike Schultz Construction Inc
Bought by
Mike Schultz Construction Inc
Purchase Details
Closed on
Feb 22, 2001
Sold by
Castle Homes Llc
Bought by
Saxey Kent H
Create a Home Valuation Report for This Property
The Home Valuation Report is an in-depth analysis detailing your home's value as well as a comparison with similar homes in the area
Home Values in the Area
Average Home Value in this Area
Purchase History
| Date | Buyer | Sale Price | Title Company |
|---|---|---|---|
| The John & Patricia Provence Living Tr | -- | None Available | |
| Provence John K | -- | -- | |
| Mike Schultz Construction Inc | -- | -- | |
| Saxey Kent H | -- | Title One Inc |
Source: Public Records
Mortgage History
| Date | Status | Borrower | Loan Amount |
|---|---|---|---|
| Open | Provence John K | $123,045 |
Source: Public Records
Tax History Compared to Growth
Tax History
| Year | Tax Paid | Tax Assessment Tax Assessment Total Assessment is a certain percentage of the fair market value that is determined by local assessors to be the total taxable value of land and additions on the property. | Land | Improvement |
|---|---|---|---|---|
| 2025 | $2,824 | $413,955 | $137,272 | $276,683 |
| 2024 | $2,869 | $227,149 | $75,503 | $151,646 |
| 2023 | $2,540 | $202,400 | $66,906 | $135,494 |
| 2022 | $2,733 | $218,351 | $52,663 | $165,688 |
| 2021 | $2,345 | $311,000 | $74,286 | $236,714 |
| 2020 | $2,229 | $273,000 | $58,927 | $214,073 |
| 2019 | $2,226 | $256,000 | $50,352 | $205,648 |
| 2018 | $1,916 | $219,000 | $50,352 | $168,648 |
| 2017 | $1,780 | $190,000 | $43,195 | $146,805 |
| 2016 | $1,571 | $90,631 | $21,955 | $68,676 |
| 2015 | $1,532 | $86,265 | $21,955 | $64,310 |
| 2014 | $1,397 | $77,235 | $19,484 | $57,751 |
Source: Public Records
Map
Nearby Homes
- 244 W Downs Cir
- 449 Downs Dr
- 330 W Meadowbrook Dr
- 900 Century Dr Unit 4
- 900 Century Dr Unit 29
- 900 Century Dr Unit 69
- 900 Century Dr Unit 9
- 900 Century Dr Unit 66
- 900 Century Dr Unit 7
- 889 S Clover Cir
- 856 S 200 W
- 197 W 2nd St
- 5204 S Century Way Unit 331
- 5332 S Century Way W Unit 111
- 900 S Century Dr Unit 59
- 154 7th St Unit A101
- 152 W 2nd St
- 155 E 900 St S
- 155 E 900 St S Unit 214
- 155 E 900 St S Unit 208