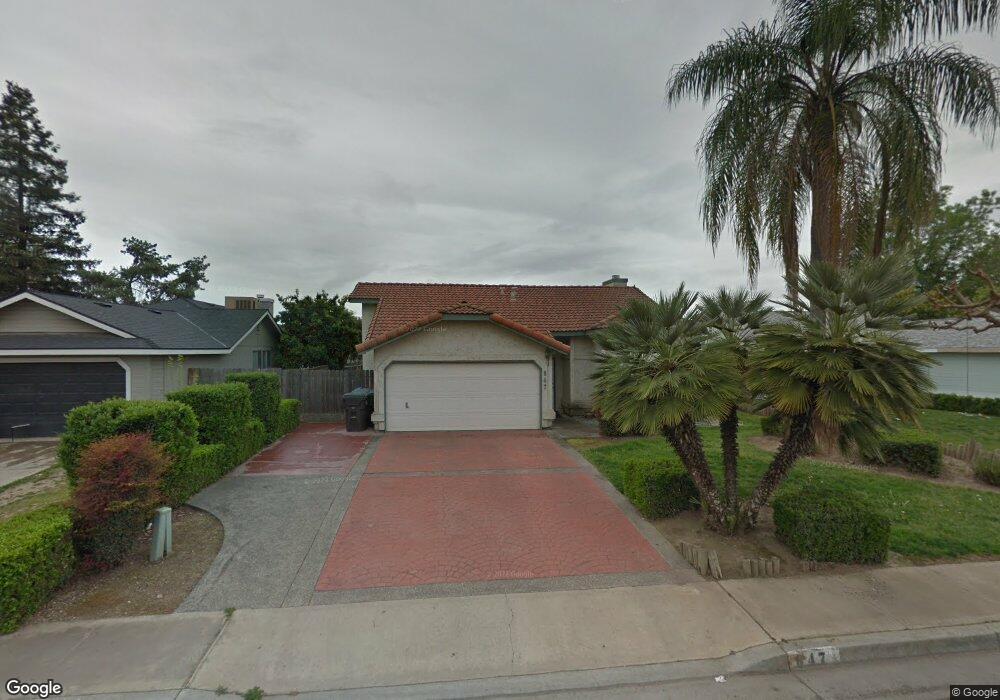
647 W Petunia St Farmersville, CA 93223
Estimated Value: $316,000 - $337,251
3
Beds
2
Baths
1,500
Sq Ft
$218/Sq Ft
Est. Value
About This Home
This home is located at 647 W Petunia St, Farmersville, CA 93223 and is currently estimated at $326,313, approximately $217 per square foot. 647 W Petunia St is a home located in Tulare County with nearby schools including Freedom Elementary School, J.E. Hester Elementary School, and George L. Snowden Elementary School.
Ownership History
Date
Name
Owned For
Owner Type
Purchase Details
Closed on
Aug 4, 2004
Sold by
Monk David L
Bought by
Lopez Sergio and Del Hoyo Maria R
Current Estimated Value
Home Financials for this Owner
Home Financials are based on the most recent Mortgage that was taken out on this home.
Original Mortgage
$157,771
Outstanding Balance
$78,081
Interest Rate
5.97%
Mortgage Type
FHA
Estimated Equity
$248,232
Purchase Details
Closed on
Jul 6, 2001
Sold by
Wiley James B
Bought by
Monk David L and Monk Lena R
Home Financials for this Owner
Home Financials are based on the most recent Mortgage that was taken out on this home.
Original Mortgage
$108,200
Interest Rate
7.09%
Purchase Details
Closed on
Jan 9, 2001
Sold by
Wiley Amy A
Bought by
Wiley James B
Purchase Details
Closed on
Jun 19, 1996
Sold by
Webb Marshall C
Bought by
Wiley James B and Wiley Amy A
Create a Home Valuation Report for This Property
The Home Valuation Report is an in-depth analysis detailing your home's value as well as a comparison with similar homes in the area
Home Values in the Area
Average Home Value in this Area
Purchase History
| Date | Buyer | Sale Price | Title Company |
|---|---|---|---|
| Lopez Sergio | $160,000 | -- | |
| Monk David L | $102,000 | First American Title Co | |
| Wiley James B | -- | Chicago Title Co | |
| Wiley James B | $99,500 | First American Title Ins Co |
Source: Public Records
Mortgage History
| Date | Status | Borrower | Loan Amount |
|---|---|---|---|
| Open | Lopez Sergio | $157,771 | |
| Previous Owner | Monk David L | $108,200 |
Source: Public Records
Tax History Compared to Growth
Tax History
| Year | Tax Paid | Tax Assessment Tax Assessment Total Assessment is a certain percentage of the fair market value that is determined by local assessors to be the total taxable value of land and additions on the property. | Land | Improvement |
|---|---|---|---|---|
| 2025 | $2,425 | $223,026 | $41,818 | $181,208 |
| 2024 | $2,425 | $218,654 | $40,999 | $177,655 |
| 2023 | $2,432 | $214,368 | $40,196 | $174,172 |
| 2022 | $2,255 | $210,165 | $39,408 | $170,757 |
| 2021 | $2,214 | $206,044 | $38,635 | $167,409 |
| 2020 | $2,200 | $203,931 | $38,239 | $165,692 |
| 2019 | $2,214 | $199,932 | $37,489 | $162,443 |
| 2018 | $2,161 | $196,012 | $36,754 | $159,258 |
| 2017 | $1,770 | $157,000 | $39,000 | $118,000 |
| 2016 | $1,613 | $148,000 | $37,000 | $111,000 |
| 2015 | $1,409 | $156,000 | $39,000 | $117,000 |
| 2014 | $1,409 | $131,000 | $33,000 | $98,000 |
Source: Public Records
Map
Nearby Homes
- 0 S Farmersville Blvd Unit 238390
- 896 Farmersville Rd
- 896 N Mariposa Ave
- 701 Farmersville Rd
- 188 E Citrus Dr
- 1643 Tehama Ave
- 0 Avenue 288
- 322 E Citrus Dr
- 438 N Magnolia Ave
- 0 Apn 128-030-056-000 Unit 218742
- 209 S Magnolia Ave
- 0 Avenue 288
- 391 Teddy St
- 680 E Larry St
- 327 S Farmersville Blvd
- 738 E Larry St
- 885 E Ash St
- 903 E Ash St
- 245 W Oakland St
- 732 N Dwight Ave
- 667 W Petunia St
- 627 W Petunia St
- 607 W Petunia St
- 648 W Petunia St
- 606 W Petunia St
- 587 W Petunia St
- 697 W Petunia St
- 686 W Petunia St
- 1001 N Steven Ave
- 567 W Petunia St
- 1011 N Matthew Ave
- 1007 N Steven Ave
- 586 W Petunia St
- 547 W Petunia St
- 1032 N Steven Ave
- 1031 N Matthew Ave
- 1011 N Steven Ave
- 1002 N June Ave
- 548 W Petunia St
- 1012 N Matthew Ave