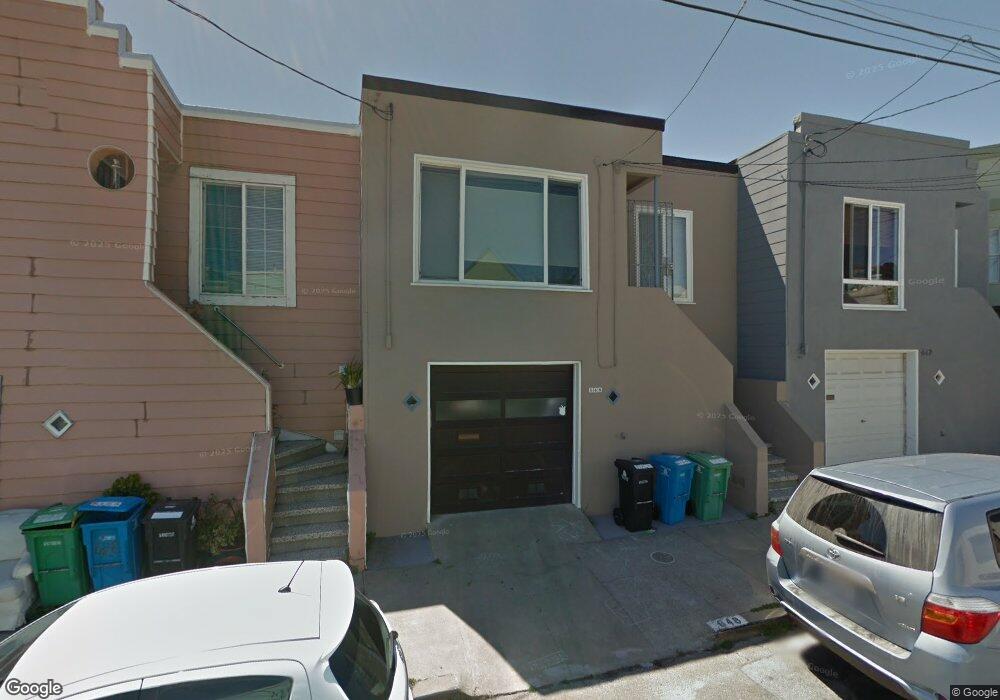
648 Gates St San Francisco, CA 94110
Bernal Heights NeighborhoodEstimated Value: $1,046,000 - $1,581,000
--
Bed
1
Bath
1,000
Sq Ft
$1,225/Sq Ft
Est. Value
About This Home
This home is located at 648 Gates St, San Francisco, CA 94110 and is currently estimated at $1,224,845, approximately $1,224 per square foot. 648 Gates St is a home located in San Francisco County with nearby schools including Leonard R. Flynn Elementary, James Lick Middle School, and San Francisco School.
Ownership History
Date
Name
Owned For
Owner Type
Purchase Details
Closed on
Jun 4, 2025
Sold by
Handleman Karen
Bought by
Karen Handleman Revocable Trust and Handleman
Current Estimated Value
Purchase Details
Closed on
Jun 11, 1999
Sold by
Ancheta Family Revocable Trust and Florencio B
Bought by
Handleman Karen
Home Financials for this Owner
Home Financials are based on the most recent Mortgage that was taken out on this home.
Original Mortgage
$220,000
Interest Rate
7.01%
Create a Home Valuation Report for This Property
The Home Valuation Report is an in-depth analysis detailing your home's value as well as a comparison with similar homes in the area
Home Values in the Area
Average Home Value in this Area
Purchase History
| Date | Buyer | Sale Price | Title Company |
|---|---|---|---|
| Karen Handleman Revocable Trust | -- | None Listed On Document | |
| Handleman Karen | $280,000 | First American Title Co |
Source: Public Records
Mortgage History
| Date | Status | Borrower | Loan Amount |
|---|---|---|---|
| Previous Owner | Handleman Karen | $220,000 |
Source: Public Records
Tax History Compared to Growth
Tax History
| Year | Tax Paid | Tax Assessment Tax Assessment Total Assessment is a certain percentage of the fair market value that is determined by local assessors to be the total taxable value of land and additions on the property. | Land | Improvement |
|---|---|---|---|---|
| 2025 | $5,748 | $438,933 | $263,362 | $175,571 |
| 2024 | $5,748 | $430,328 | $258,199 | $172,129 |
| 2023 | $5,652 | $421,891 | $253,137 | $168,754 |
| 2022 | $5,530 | $413,620 | $248,174 | $165,446 |
| 2021 | $5,426 | $405,510 | $243,308 | $162,202 |
| 2020 | $5,466 | $401,353 | $240,814 | $160,539 |
| 2019 | $5,281 | $393,485 | $236,093 | $157,392 |
| 2018 | $5,104 | $385,770 | $231,464 | $154,306 |
| 2017 | $4,744 | $378,207 | $226,926 | $151,281 |
| 2016 | $4,642 | $370,792 | $222,477 | $148,315 |
| 2015 | $4,582 | $365,224 | $219,136 | $146,088 |
| 2014 | $4,461 | $358,071 | $214,844 | $143,227 |
Source: Public Records
Map
Nearby Homes