

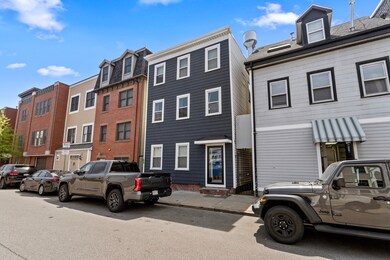
649 E 2nd St Unit 2 Boston, MA 02127
South Boston Neighborhood
1
Bed
1
Bath
579
Sq Ft
$140/mo
HOA Fee
About This Home
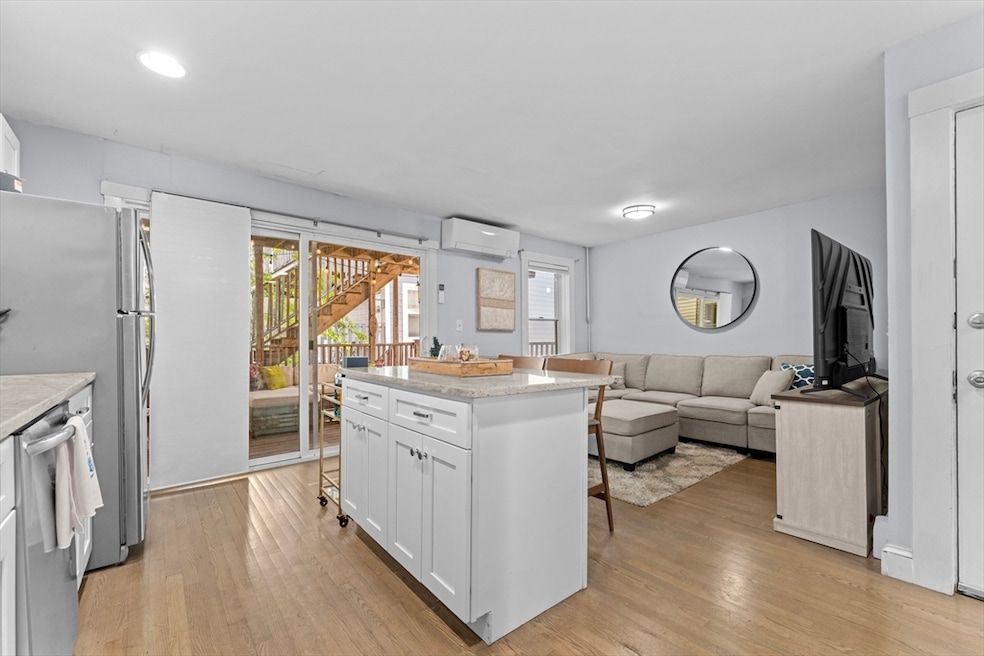
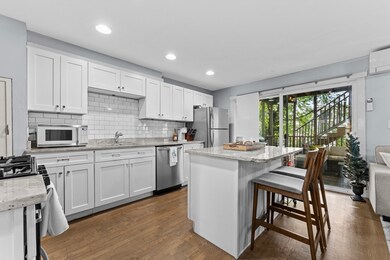
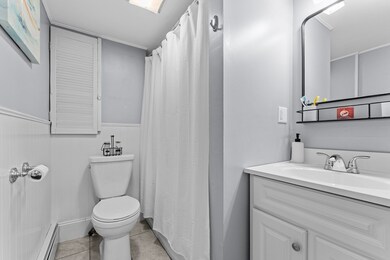
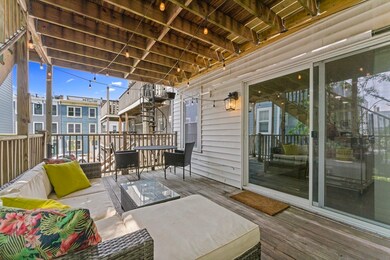
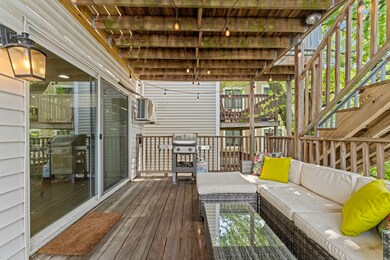
As of June 2025Welcome to Unit 2 at 649 E 2nd St—a charming, sun-filled 1-bedroom, 1-bath condo located in the heart of South Boston. This thoughtfully updated home features hardwood floors throughout, an oversized bedroom with generous closet space, a renovated bathroom, and a kitchen with granite countertops and a dishwasher. Enjoy seamless indoor-outdoor living with your own private 200 sqft. rear deck—perfect for relaxing or entertaining. Additional highlights include deeded basement storage and on-site laundry. Just steps from East Broadway, L Street, restaurants, shops, and public transportation, with easy access to I-93 and I-90, this well-maintained home blends historic charm with modern convenience in one of Southie’s most sought-after locations.
Property Details
Home Type
- Condominium
Est. Annual Taxes
- $5,605
Year Built
- Built in 1905
HOA Fees
- $140 Monthly HOA Fees
Interior Spaces
- 579 Sq Ft Home
- 1-Story Property
Bedrooms and Bathrooms
- 1 Bedroom
- 1 Full Bathroom
Utilities
- Cooling System Mounted In Outer Wall Opening
- Forced Air Heating System
- 110 Volts
Listing and Financial Details
- Assessor Parcel Number W:06 P:03453 S:004,1414217
Community Details
Overview
- Association fees include water, sewer, insurance
- 3 Units
Pet Policy
- Pets Allowed
Ownership History
Date
Name
Owned For
Owner Type
Purchase Details
Listed on
Jun 9, 2025
Closed on
Jun 12, 2025
Sold by
Brady Daniel
Bought by
Shuman Kyle and Shuman Peter
Seller's Agent
The Broadway Group
Engel & Volkers Boston
Buyer's Agent
The Broadway Group
Engel & Volkers Boston
List Price
$529,000
Sold Price
$520,000
Premium/Discount to List
-$9,000
-1.7%
Views
6
Home Financials for this Owner
Home Financials are based on the most recent Mortgage that was taken out on this home.
Avg. Annual Appreciation
185.28%
Original Mortgage
$364,000
Outstanding Balance
$363,687
Interest Rate
6.76%
Mortgage Type
Purchase Money Mortgage
Estimated Equity
$195,906
Purchase Details
Listed on
Feb 7, 2019
Closed on
Mar 17, 2019
Sold by
Crowley Ryan and Crowley Michelle
Bought by
Brady Daniel
Seller's Agent
Kevin Lewis
Coldwell Banker Realty - Hingham
Buyer's Agent
Ryan Glass
Gibson Sotheby's International Realty
List Price
$455,000
Sold Price
$495,000
Premium/Discount to List
$40,000
8.79%
Home Financials for this Owner
Home Financials are based on the most recent Mortgage that was taken out on this home.
Avg. Annual Appreciation
0.79%
Original Mortgage
$480,150
Interest Rate
4.4%
Mortgage Type
New Conventional
Purchase Details
Listed on
Aug 28, 2015
Closed on
Oct 15, 2015
Sold by
Markesich Sarah
Bought by
Crowley Ryan and Megnia Michelle
Seller's Agent
Robert Fitzharris
Seaport Realty Group
Buyer's Agent
Kevin Lewis
Coldwell Banker Realty - Hingham
List Price
$339,000
Sold Price
$350,000
Premium/Discount to List
$11,000
3.24%
Home Financials for this Owner
Home Financials are based on the most recent Mortgage that was taken out on this home.
Avg. Annual Appreciation
10.60%
Original Mortgage
$337,250
Interest Rate
3.88%
Mortgage Type
New Conventional
Purchase Details
Closed on
Apr 4, 2011
Sold by
Cotter David
Bought by
Karkesich Sarah
Purchase Details
Closed on
Oct 27, 2006
Sold by
649 E 2Nd Street Condo and Lefebvre
Bought by
Cotter David and Markesich Sarah
Home Financials for this Owner
Home Financials are based on the most recent Mortgage that was taken out on this home.
Original Mortgage
$248,000
Interest Rate
6.48%
Mortgage Type
Purchase Money Mortgage
Purchase Details
Closed on
Oct 31, 2003
Sold by
Forbes Elizabeth M
Bought by
Lefebvre Candice and Lefebvre John
Similar Homes in the area
Create a Home Valuation Report for This Property
The Home Valuation Report is an in-depth analysis detailing your home's value as well as a comparison with similar homes in the area
Home Values in the Area
Average Home Value in this Area
Purchase History
| Date | Type | Sale Price | Title Company |
|---|---|---|---|
| Deed | $520,000 | None Available | |
| Deed | $520,000 | None Available | |
| Condominium Deed | $495,000 | -- | |
| Condominium Deed | $495,000 | -- | |
| Not Resolvable | $355,000 | -- | |
| Deed | $5,100 | -- | |
| Deed | $5,100 | -- | |
| Deed | $254,000 | -- | |
| Deed | $254,000 | -- | |
| Deed | $210,000 | -- | |
| Deed | $210,000 | -- |
Source: Public Records
Mortgage History
| Date | Status | Loan Amount | Loan Type |
|---|---|---|---|
| Open | $364,000 | Purchase Money Mortgage | |
| Closed | $364,000 | Purchase Money Mortgage | |
| Previous Owner | $474,750 | Stand Alone Refi Refinance Of Original Loan | |
| Previous Owner | $480,150 | New Conventional | |
| Previous Owner | $337,250 | New Conventional | |
| Previous Owner | $219,585 | No Value Available | |
| Previous Owner | $229,500 | No Value Available | |
| Previous Owner | $248,000 | Purchase Money Mortgage |
Source: Public Records
Property History
| Date | Event | Price | Change | Sq Ft Price |
|---|---|---|---|---|
| 07/11/2025 07/11/25 | For Rent | $3,100 | 0.0% | -- |
| 06/16/2025 06/16/25 | Sold | $520,000 | -1.7% | $898 / Sq Ft |
| 06/09/2025 06/09/25 | Pending | -- | -- | -- |
| 06/09/2025 06/09/25 | For Sale | $529,000 | +6.9% | $914 / Sq Ft |
| 03/22/2019 03/22/19 | Sold | $495,000 | +8.8% | $855 / Sq Ft |
| 02/08/2019 02/08/19 | Pending | -- | -- | -- |
| 02/07/2019 02/07/19 | For Sale | $455,000 | +30.0% | $786 / Sq Ft |
| 10/15/2015 10/15/15 | Sold | $350,000 | +3.2% | $604 / Sq Ft |
| 09/16/2015 09/16/15 | Pending | -- | -- | -- |
| 08/27/2015 08/27/15 | For Sale | $339,000 | -- | $585 / Sq Ft |
Source: MLS Property Information Network (MLS PIN)
Tax History Compared to Growth
Tax History
| Year | Tax Paid | Tax Assessment Tax Assessment Total Assessment is a certain percentage of the fair market value that is determined by local assessors to be the total taxable value of land and additions on the property. | Land | Improvement |
|---|---|---|---|---|
| 2025 | $5,605 | $484,000 | $0 | $484,000 |
| 2024 | $5,331 | $489,100 | $0 | $489,100 |
| 2023 | $5,146 | $479,100 | $0 | $479,100 |
| 2022 | $5,011 | $460,600 | $0 | $460,600 |
| 2021 | $4,589 | $430,100 | $0 | $430,100 |
| 2020 | $3,964 | $375,400 | $0 | $375,400 |
| 2019 | $3,700 | $351,000 | $0 | $351,000 |
| 2018 | $3,502 | $334,200 | $0 | $334,200 |
| 2017 | $3,308 | $312,400 | $0 | $312,400 |
| 2016 | $3,242 | $294,700 | $0 | $294,700 |
| 2015 | $3,040 | $251,000 | $0 | $251,000 |
| 2014 | $2,818 | $224,000 | $0 | $224,000 |
Source: Public Records
Agents Affiliated with this Home
-
Mark Mesdary
Seller's Agent in 2025
Mark Mesdary
Engel & Volkers Boston
(774) 573-3485
12 Total Sales
-
The Broadway Group
T
Seller's Agent in 2025
The Broadway Group
Engel & Volkers Boston
(617) 294-1103
6 in this area
79 Total Sales
-
Nate Rock
Seller Co-Listing Agent in 2025
Nate Rock
Engel & Volkers Boston
(617) 459-6656
3 in this area
42 Total Sales
-
Kevin Lewis
Seller's Agent in 2019
Kevin Lewis
Coldwell Banker Realty - Hingham
(781) 285-8028
49 in this area
278 Total Sales
-
Ryan Glass
Buyer's Agent in 2019
Ryan Glass
Gibson Sothebys International Realty
(617) 721-2143
24 in this area
155 Total Sales
-
R
Seller's Agent in 2015
Robert Fitzharris
Seaport Realty Group
Map
Source: MLS Property Information Network (MLS PIN)
MLS Number: 73388015
APN: SBOS-000000-000006-003453-000004
Disclaimer: Certain information contained herein is derived from information provided by parties other than Homes.com. All information provided is deemed reliable, but is not guaranteed to be accurate and should be independently verified.
![]() The property listing data and information, or the Images, set forth herein were provided to MLS Property Information Network, Inc. from third party sources, including sellers, lessors and public records, and were compiled by MLS Property Information Network, Inc. The property listing data and information, and the Images, are for the personal, non-commercial use of consumers having a good faith interest in purchasing or leasing listed properties of the type displayed to them and may not be used for any purpose other than to identify prospective properties which such consumers may have a good faith interest in purchasing or leasing. MLS Property Information Network, Inc. and its subscribers disclaim any and all representations and warranties as to the accuracy of the property listing data and information, or as to the accuracy of any of the Images, set forth herein.
The property listing data and information, or the Images, set forth herein were provided to MLS Property Information Network, Inc. from third party sources, including sellers, lessors and public records, and were compiled by MLS Property Information Network, Inc. The property listing data and information, and the Images, are for the personal, non-commercial use of consumers having a good faith interest in purchasing or leasing listed properties of the type displayed to them and may not be used for any purpose other than to identify prospective properties which such consumers may have a good faith interest in purchasing or leasing. MLS Property Information Network, Inc. and its subscribers disclaim any and all representations and warranties as to the accuracy of the property listing data and information, or as to the accuracy of any of the Images, set forth herein.
Nearby Homes
- 673 E 2nd St Unit 2
- 191 K St Unit parking 7
- 571 E 3rd St
- 202 K St Unit 4
- 1 Schrepel Place
- 49 L St Unit 3
- 550 E 3rd St
- 57 L St Unit H
- 617-619 E 2nd St Unit 1
- 618 E 2nd St Unit 2
- 647 E 3rd St
- 714 E 4th St Unit 3
- 9-11 Linley Terrace Unit 2
- 503 E 1st St Unit 8
- 14 I St Unit 7
- 12 I St Unit 1
- 54 I St
- 17 M St
- 707 E 4th St Unit 2
- 37 I St Unit 3