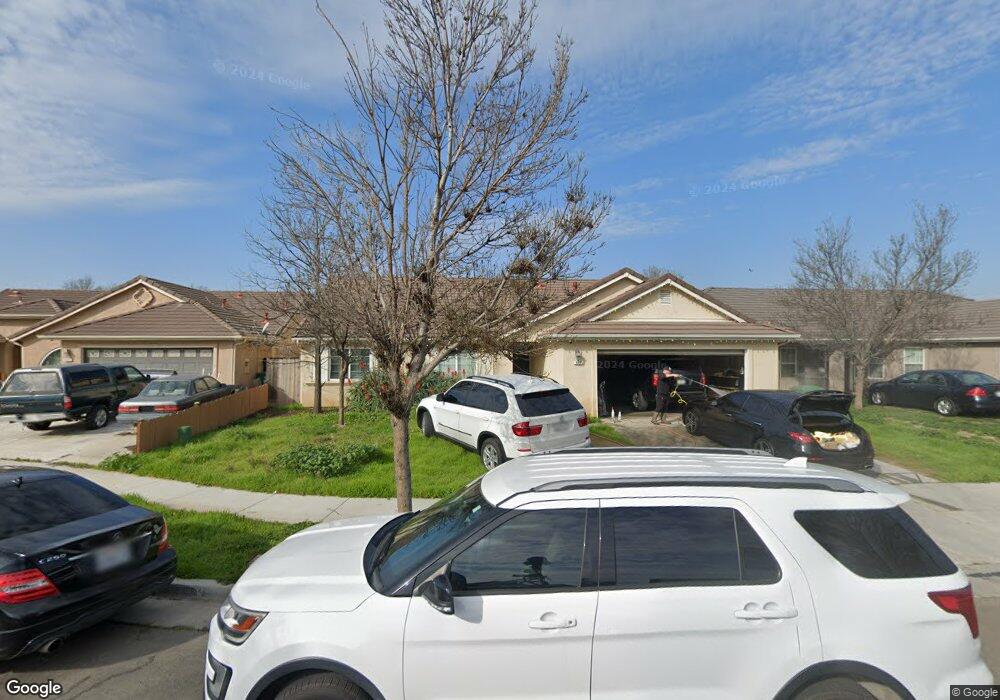
649 Kensington Cir Los Banos, CA 93635
Estimated Value: $406,714 - $457,000
4
Beds
2
Baths
1,537
Sq Ft
$282/Sq Ft
Est. Value
About This Home
This home is located at 649 Kensington Cir, Los Banos, CA 93635 and is currently estimated at $433,679, approximately $282 per square foot. 649 Kensington Cir is a home located in Merced County with nearby schools including R.M. Miano Elementary School, Los Banos Junior High School, and Pacheco High School.
Ownership History
Date
Name
Owned For
Owner Type
Purchase Details
Closed on
Aug 20, 2009
Sold by
Us Bank National Association
Bought by
Li Jie and Chen Jin
Current Estimated Value
Purchase Details
Closed on
Jun 19, 2009
Sold by
Gaona Dawn D and Gaona Carlos T
Bought by
Us Bank National Association
Purchase Details
Closed on
Nov 22, 2006
Sold by
Gaona Dawn D and Gaona Carlos T
Bought by
Gaona Carlos T and Gaona Dawn D
Home Financials for this Owner
Home Financials are based on the most recent Mortgage that was taken out on this home.
Original Mortgage
$328,000
Interest Rate
7.75%
Mortgage Type
New Conventional
Purchase Details
Closed on
Mar 17, 2006
Sold by
Regency Park Estates 1-4 Llc
Bought by
Gaona Carlos T and Gaona Dawn D
Home Financials for this Owner
Home Financials are based on the most recent Mortgage that was taken out on this home.
Original Mortgage
$303,054
Interest Rate
6.62%
Mortgage Type
Stand Alone First
Create a Home Valuation Report for This Property
The Home Valuation Report is an in-depth analysis detailing your home's value as well as a comparison with similar homes in the area
Home Values in the Area
Average Home Value in this Area
Purchase History
| Date | Buyer | Sale Price | Title Company |
|---|---|---|---|
| Li Jie | $112,500 | First American Title Company | |
| Us Bank National Association | $80,000 | Accommodation | |
| Gaona Carlos T | -- | Alliance Title Company | |
| Gaona Carlos T | $379,000 | Fidelity Natl Title Co Of Ca |
Source: Public Records
Mortgage History
| Date | Status | Borrower | Loan Amount |
|---|---|---|---|
| Previous Owner | Gaona Carlos T | $328,000 | |
| Previous Owner | Gaona Carlos T | $303,054 |
Source: Public Records
Tax History Compared to Growth
Tax History
| Year | Tax Paid | Tax Assessment Tax Assessment Total Assessment is a certain percentage of the fair market value that is determined by local assessors to be the total taxable value of land and additions on the property. | Land | Improvement |
|---|---|---|---|---|
| 2025 | $2,499 | $145,202 | $32,263 | $112,939 |
| 2024 | $2,499 | $142,356 | $31,631 | $110,725 |
| 2023 | $2,362 | $139,565 | $31,011 | $108,554 |
| 2022 | $2,295 | $136,829 | $30,403 | $106,426 |
| 2021 | $2,234 | $134,147 | $29,807 | $104,340 |
| 2020 | $2,181 | $132,773 | $29,502 | $103,271 |
| 2019 | $2,131 | $130,171 | $28,924 | $101,247 |
| 2018 | $2,063 | $127,619 | $28,357 | $99,262 |
| 2017 | $2,008 | $125,117 | $27,801 | $97,316 |
| 2016 | $1,989 | $122,664 | $27,256 | $95,408 |
| 2015 | $1,929 | $120,822 | $26,847 | $93,975 |
| 2014 | $1,862 | $118,457 | $26,322 | $92,135 |
Source: Public Records
Map
Nearby Homes
- 1537 Cardinal St
- 510 Stonehaven Dr
- 1364 Dove St
- 436 N Mercey Springs Rd Unit 69
- 436 N Mercey Springs Rd Unit 16
- 436 N Mercey Springs Rd Unit 93
- 436 N Mercey Springs Rd Unit 154
- 766 Meadowlark Ave
- 2054 Casey Ln
- 448 Barrett Ln
- 543 N Mercey Springs Rd
- 1349 Quail St
- 418 Rockport Dr
- 1406 Quail St
- 432 Barrett Ln
- 814 Del Rio Dr
- 1338 Quail St
- 424 Barrett Ln
- Residence 3 Plan at Southpointe - Sierra Heights
- Residence 2 Plan at Southpointe - Sierra Heights
- 645 Kensington Cir
- 653 Kensington Cir
- 556 Fairmont Dr
- 562 Fairmont Dr
- 641 Kensington Cir
- 550 Fairmont Dr
- 657 Kensington Cir
- 610 Fairmont Dr
- 544 Fairmont Dr
- 646 Kensington Cir
- 650 Kensington Cir
- 637 Kensington Cir
- 642 Kensington Cir
- 661 Kensington Cir
- 538 Fairmont Dr
- 616 Fairmont Dr
- 638 Kensington Cir
- 663 Kensington Cir
- 633 Kensington Cir
- 658 Kensington Cir