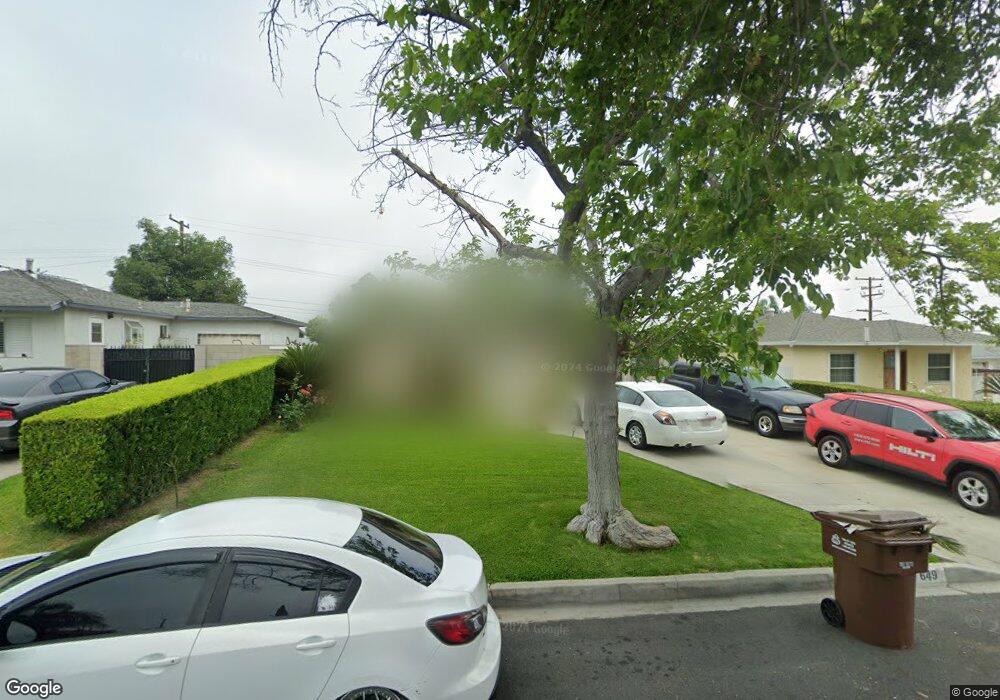
649 Molinar Ave La Puente, CA 91744
Estimated Value: $634,446 - $788,000
3
Beds
1
Bath
930
Sq Ft
$743/Sq Ft
Est. Value
About This Home
This home is located at 649 Molinar Ave, La Puente, CA 91744 and is currently estimated at $691,112, approximately $743 per square foot. 649 Molinar Ave is a home located in Los Angeles County with nearby schools including Del Valle Elementary School, Sierra Vista Middle School, and La Puente High School.
Ownership History
Date
Name
Owned For
Owner Type
Purchase Details
Closed on
Apr 3, 2003
Sold by
Vazquez Elias
Bought by
Mata Tomas Vazquez
Current Estimated Value
Home Financials for this Owner
Home Financials are based on the most recent Mortgage that was taken out on this home.
Original Mortgage
$103,900
Interest Rate
5.6%
Purchase Details
Closed on
Jun 13, 1996
Sold by
Culver Robert Franklin
Bought by
Gussler Percy L and Gussler Virginia
Home Financials for this Owner
Home Financials are based on the most recent Mortgage that was taken out on this home.
Original Mortgage
$104,400
Interest Rate
8.09%
Purchase Details
Closed on
Apr 29, 1996
Sold by
Gussler Percy L
Bought by
Vazquez Elias
Home Financials for this Owner
Home Financials are based on the most recent Mortgage that was taken out on this home.
Original Mortgage
$104,400
Interest Rate
8.09%
Create a Home Valuation Report for This Property
The Home Valuation Report is an in-depth analysis detailing your home's value as well as a comparison with similar homes in the area
Home Values in the Area
Average Home Value in this Area
Purchase History
| Date | Buyer | Sale Price | Title Company |
|---|---|---|---|
| Mata Tomas Vazquez | -- | Diversified Title & Escrow S | |
| Gussler Percy L | -- | -- | |
| Vazquez Elias | $116,000 | -- |
Source: Public Records
Mortgage History
| Date | Status | Borrower | Loan Amount |
|---|---|---|---|
| Closed | Mata Tomas Vazquez | $103,900 | |
| Previous Owner | Vazquez Elias | $104,400 |
Source: Public Records
Tax History Compared to Growth
Tax History
| Year | Tax Paid | Tax Assessment Tax Assessment Total Assessment is a certain percentage of the fair market value that is determined by local assessors to be the total taxable value of land and additions on the property. | Land | Improvement |
|---|---|---|---|---|
| 2025 | $3,835 | $289,642 | $173,788 | $115,854 |
| 2024 | $3,835 | $283,964 | $170,381 | $113,583 |
| 2023 | $3,740 | $278,397 | $167,041 | $111,356 |
| 2022 | $3,635 | $272,939 | $163,766 | $109,173 |
| 2021 | $3,571 | $267,588 | $160,555 | $107,033 |
| 2019 | $3,472 | $259,653 | $155,794 | $103,859 |
| 2018 | $3,355 | $254,563 | $152,740 | $101,823 |
| 2016 | $3,118 | $244,680 | $146,810 | $97,870 |
| 2015 | $3,061 | $241,005 | $144,605 | $96,400 |
| 2014 | $3,017 | $236,285 | $141,773 | $94,512 |
Source: Public Records
Map
Nearby Homes
- 665 Larimore Ave
- 545 N 5th St
- 15879 Hill St
- 826 Del Valle Ave
- 15625 Loukelton St
- 15732 Victoria Ave
- 15416 Giordano St
- 15900 Rowland St
- 11 Alley Way
- 15925 Amar Rd
- 1084 Del Valle Ave
- 15937 Amar Rd
- 15943 Amar Rd
- 15947 Amar Rd
- 138 Banbridge Ave
- 665 Lidford Ave
- 15246 Temple Ave
- 16322 Main St
- 1174 Del Valle Ave
- 16138 Cadwell St
- 653 Molinar Ave
- 643 Molinar Ave
- 659 Molinar Ave
- 639 Molinar Ave
- 654 Gilwood Ave
- 648 Gilwood Ave
- 658 Gilwood Ave
- 664 Gilwood Ave
- 642 Gilwood Ave
- 633 Molinar Ave
- 648 Molinar Ave Unit 2
- 648 Molinar Ave
- 652 Molinar Ave
- 642 Molinar Ave
- 658 Molinar Ave
- 638 Gilwood Ave
- 638 Molinar Ave
- 627 Molinar Ave
- 632 Molinar Ave
- 632 Gilwood Ave