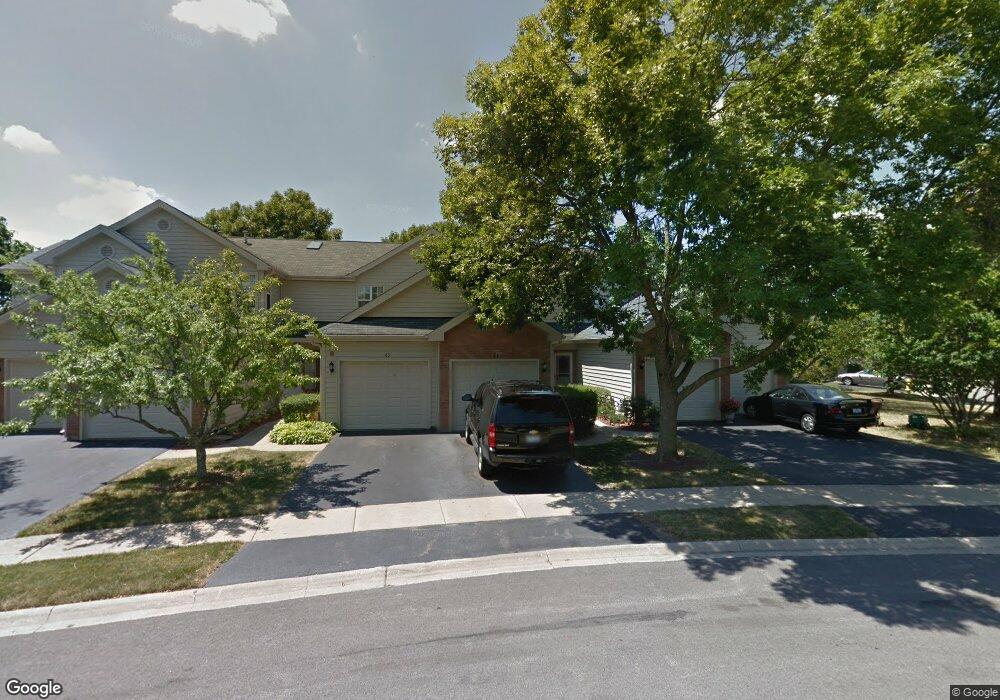
65 Fairway Dr Unit 5 Glendale Heights, IL 60139
Estimated Value: $287,000 - $307,000
2
Beds
3
Baths
1,248
Sq Ft
$238/Sq Ft
Est. Value
About This Home
This home is located at 65 Fairway Dr Unit 5, Glendale Heights, IL 60139 and is currently estimated at $297,491, approximately $238 per square foot. 65 Fairway Dr Unit 5 is a home located in DuPage County with nearby schools including Americana Intermediate School, Glen Hill Primary School, and Glenside Middle School.
Ownership History
Date
Name
Owned For
Owner Type
Purchase Details
Closed on
Mar 22, 2004
Sold by
Guillen Jessica
Bought by
Guillen Francisco and Guillen Jessica
Current Estimated Value
Home Financials for this Owner
Home Financials are based on the most recent Mortgage that was taken out on this home.
Original Mortgage
$148,500
Outstanding Balance
$69,354
Interest Rate
5.66%
Mortgage Type
New Conventional
Estimated Equity
$228,137
Purchase Details
Closed on
Feb 14, 2003
Sold by
Kosac Kenneth W and Kosac Christina M
Bought by
Guillen Jessica Marie
Home Financials for this Owner
Home Financials are based on the most recent Mortgage that was taken out on this home.
Original Mortgage
$147,700
Interest Rate
6.06%
Purchase Details
Closed on
Dec 30, 1996
Sold by
Smith Robert C
Bought by
Kosac Kenneth W
Home Financials for this Owner
Home Financials are based on the most recent Mortgage that was taken out on this home.
Original Mortgage
$102,812
Interest Rate
7.6%
Mortgage Type
FHA
Create a Home Valuation Report for This Property
The Home Valuation Report is an in-depth analysis detailing your home's value as well as a comparison with similar homes in the area
Home Values in the Area
Average Home Value in this Area
Purchase History
| Date | Buyer | Sale Price | Title Company |
|---|---|---|---|
| Guillen Francisco | -- | Pntn | |
| Guillen Jessica Marie | $155,500 | Multiple | |
| Kosac Kenneth W | $104,000 | Plm Title Company |
Source: Public Records
Mortgage History
| Date | Status | Borrower | Loan Amount |
|---|---|---|---|
| Open | Guillen Francisco | $148,500 | |
| Closed | Guillen Jessica Marie | $147,700 | |
| Previous Owner | Kosac Kenneth W | $102,812 |
Source: Public Records
Tax History Compared to Growth
Tax History
| Year | Tax Paid | Tax Assessment Tax Assessment Total Assessment is a certain percentage of the fair market value that is determined by local assessors to be the total taxable value of land and additions on the property. | Land | Improvement |
|---|---|---|---|---|
| 2024 | $5,925 | $72,761 | $12,105 | $60,656 |
| 2023 | $5,700 | $66,540 | $11,070 | $55,470 |
| 2022 | $5,341 | $59,230 | $11,000 | $48,230 |
| 2021 | $5,043 | $56,270 | $10,450 | $45,820 |
| 2020 | $4,841 | $54,820 | $10,190 | $44,630 |
| 2019 | $4,679 | $52,680 | $9,790 | $42,890 |
| 2018 | $4,844 | $49,070 | $9,530 | $39,540 |
| 2017 | $4,683 | $45,480 | $8,830 | $36,650 |
| 2016 | $4,486 | $42,090 | $8,170 | $33,920 |
| 2015 | $4,385 | $39,270 | $7,620 | $31,650 |
| 2014 | $4,388 | $39,010 | $7,620 | $31,390 |
| 2013 | $4,339 | $40,340 | $7,880 | $32,460 |
Source: Public Records
Map
Nearby Homes
- 108 Golfview Dr
- 1500 Golfview Ct Unit 5
- 56 N Golfview Ct
- 134 W Montana Ave
- 118 Windsor Ln
- 10 W Nevada Ave
- 179 Glen Hill Dr
- 1713 Schmale Rd
- 1188 Harbor Ct Unit 136
- 23W285 Armitage Ave
- 2N061 Bloomingdale Rd
- 1760 Lombard Ct
- 2N643 Diane Ave
- 23W570 Pine Dr
- 203 Ahmed Ct
- 200 Ahmed Ct
- 1111 Bloomingdale Rd Unit 1A
- 222 Shorewood Dr Unit GD
- 242 Shorewood Dr Unit 1B
- 251 Polo Club Dr
- 63 Fairway Dr Unit 5
- 61 Fairway Dr
- 69 Fairway Dr
- 59 Fairway Dr Unit 5
- 71 Golfview Dr
- 73 Golfview Dr Unit 5
- 57 Fairway Dr Unit 5
- 75 Golfview Dr
- 55 Fairway Dr
- 77 Golfview Dr
- 53 Fairway Dr Unit 5
- 79 Golfview Dr
- 51 Fairway Dr
- 81 Golfview Dr
- 60 Fairway Dr
- 49 Fairway Dr
- 58 Fairway Dr
- 1400 Golfview Dr
- 72 Golfview Dr
- 83 Golfview Dr