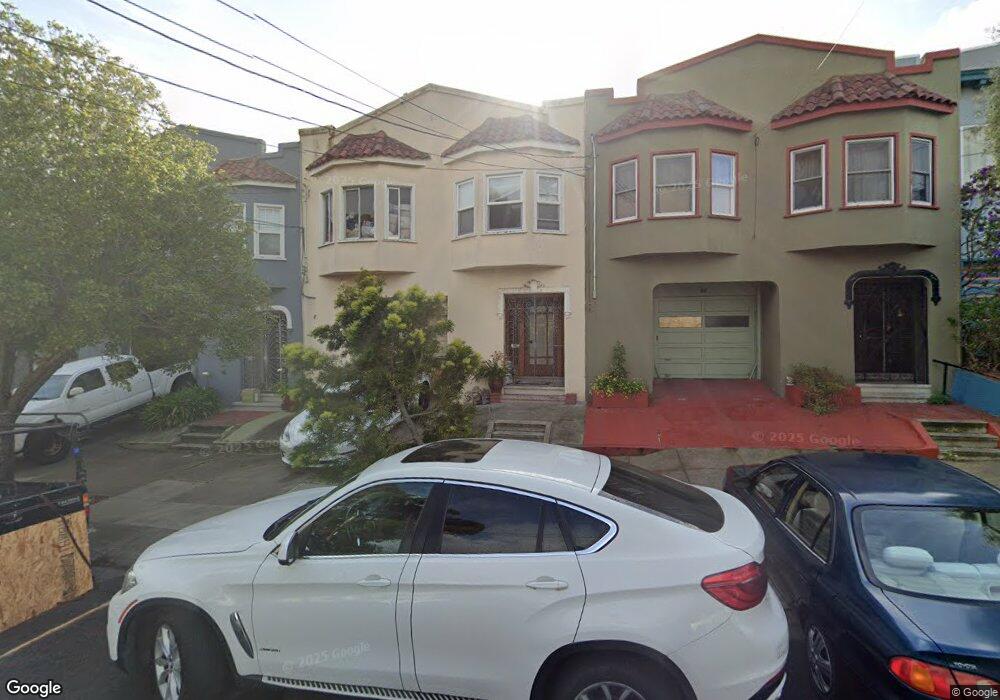
65 Lisbon St San Francisco, CA 94112
Excelsior NeighborhoodEstimated Value: $861,000 - $943,000
--
Bed
1
Bath
1,125
Sq Ft
$809/Sq Ft
Est. Value
About This Home
This home is located at 65 Lisbon St, San Francisco, CA 94112 and is currently estimated at $910,096, approximately $808 per square foot. 65 Lisbon St is a home located in San Francisco County with nearby schools including Hillcrest Elementary School, King Jr. (Martin Luther) Academic Middle School, and Cornerstone Academy.
Ownership History
Date
Name
Owned For
Owner Type
Purchase Details
Closed on
Mar 18, 2024
Sold by
Tieu Giang and Tieu Binh
Bought by
Truong Clang And Binh Tieu Giang Revocable Tr and Giang
Current Estimated Value
Purchase Details
Closed on
Apr 23, 2019
Sold by
Giang Dan and Kwong Danny
Bought by
Giang Dan and Revocable Living Trust Of Dan
Create a Home Valuation Report for This Property
The Home Valuation Report is an in-depth analysis detailing your home's value as well as a comparison with similar homes in the area
Home Values in the Area
Average Home Value in this Area
Purchase History
| Date | Buyer | Sale Price | Title Company |
|---|---|---|---|
| Truong Clang And Binh Tieu Giang Revocable Tr | -- | None Listed On Document | |
| Giang Truong | -- | None Listed On Document | |
| Giang Dan | -- | None Available |
Source: Public Records
Tax History Compared to Growth
Tax History
| Year | Tax Paid | Tax Assessment Tax Assessment Total Assessment is a certain percentage of the fair market value that is determined by local assessors to be the total taxable value of land and additions on the property. | Land | Improvement |
|---|---|---|---|---|
| 2025 | $3,299 | $218,556 | $126,849 | $91,707 |
| 2024 | $3,299 | $214,273 | $124,363 | $89,910 |
| 2023 | $3,524 | $210,027 | $121,905 | $88,122 |
| 2022 | $3,162 | $205,914 | $119,517 | $86,397 |
| 2021 | $3,101 | $201,879 | $117,174 | $84,705 |
| 2020 | $3,185 | $199,812 | $115,974 | $83,838 |
| 2019 | $3,083 | $195,987 | $113,748 | $82,239 |
| 2018 | $2,978 | $192,145 | $111,518 | $80,627 |
| 2017 | $2,645 | $188,379 | $109,332 | $79,047 |
| 2016 | $2,570 | $184,687 | $107,189 | $77,498 |
| 2015 | $2,534 | $181,913 | $105,579 | $76,334 |
| 2014 | $2,469 | $178,350 | $103,511 | $74,839 |
Source: Public Records
Map
Nearby Homes