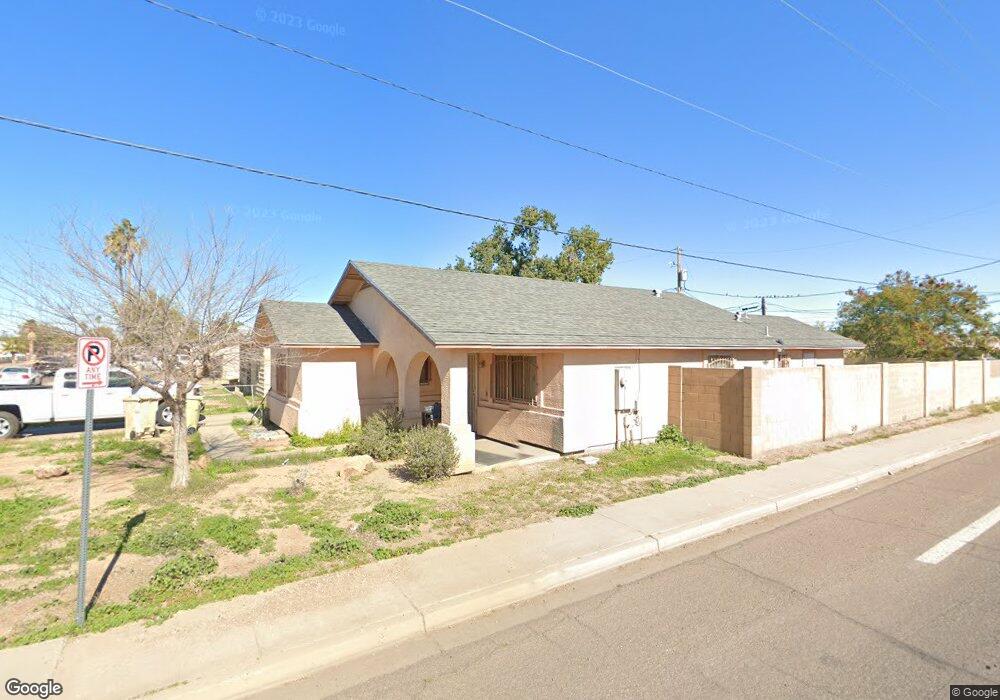
6501 N 53rd Ave Glendale, AZ 85301
Estimated Value: $296,000 - $345,000
--
Bed
2
Baths
1,403
Sq Ft
$223/Sq Ft
Est. Value
About This Home
This home is located at 6501 N 53rd Ave, Glendale, AZ 85301 and is currently estimated at $312,299, approximately $222 per square foot. 6501 N 53rd Ave is a home located in Maricopa County with nearby schools including Glenn F Burton School, Apollo High School, and Grace Lutheran School.
Ownership History
Date
Name
Owned For
Owner Type
Purchase Details
Closed on
Jun 12, 2002
Sold by
Habitat For Humanity Valley Of The Sun
Bought by
Munoz Ivan and Munoz Sandra
Current Estimated Value
Home Financials for this Owner
Home Financials are based on the most recent Mortgage that was taken out on this home.
Original Mortgage
$95,000
Outstanding Balance
$40,310
Interest Rate
6.86%
Mortgage Type
Seller Take Back
Estimated Equity
$271,989
Purchase Details
Closed on
Jan 30, 2001
Sold by
Delahuerta Ricardo
Bought by
Delahuerta Debra
Purchase Details
Closed on
Jan 24, 2001
Sold by
Rodriguez Sean Aguilar
Bought by
Rodriguez Dora
Purchase Details
Closed on
Jan 23, 2001
Sold by
Rodriguez Dora
Bought by
Habitat For Humanity Valley Of The Sun I
Purchase Details
Closed on
Jul 6, 1998
Sold by
Delahuerta Debra
Bought by
Rodriguez Sean Aguilar
Create a Home Valuation Report for This Property
The Home Valuation Report is an in-depth analysis detailing your home's value as well as a comparison with similar homes in the area
Home Values in the Area
Average Home Value in this Area
Purchase History
| Date | Buyer | Sale Price | Title Company |
|---|---|---|---|
| Munoz Ivan | $95,000 | American Title Ins Agency | |
| Delahuerta Debra | -- | Capital Title Agency | |
| Rodriguez Dora | -- | -- | |
| Habitat For Humanity Valley Of The Sun I | $14,000 | Capital Title Agency | |
| Rodriguez Sean Aguilar | -- | -- |
Source: Public Records
Mortgage History
| Date | Status | Borrower | Loan Amount |
|---|---|---|---|
| Open | Munoz Ivan | $95,000 |
Source: Public Records
Tax History Compared to Growth
Tax History
| Year | Tax Paid | Tax Assessment Tax Assessment Total Assessment is a certain percentage of the fair market value that is determined by local assessors to be the total taxable value of land and additions on the property. | Land | Improvement |
|---|---|---|---|---|
| 2025 | $979 | $7,060 | -- | -- |
| 2024 | $863 | $6,723 | -- | -- |
| 2023 | $863 | $23,900 | $4,780 | $19,120 |
| 2022 | $858 | $17,820 | $3,560 | $14,260 |
| 2021 | $847 | $13,860 | $2,770 | $11,090 |
| 2020 | $855 | $12,100 | $2,420 | $9,680 |
| 2019 | $846 | $10,620 | $2,120 | $8,500 |
| 2018 | $905 | $10,160 | $2,030 | $8,130 |
| 2017 | $731 | $11,000 | $2,200 | $8,800 |
| 2016 | $694 | $11,380 | $2,270 | $9,110 |
| 2015 | $654 | $7,500 | $1,500 | $6,000 |
Source: Public Records
Map
Nearby Homes
- 5239 W Maryland Ave
- 6541 N 54th Ave
- 4944 W Sierra Vista Dr
- 4938 W Mclellan Rd
- 6706 N 54th Dr
- 6123 N 55th Ave Unit B32
- 5002 W Bethany Home Rd Unit 104
- 5002 W Bethany Home Rd Unit 95
- 6349 N 49th Ave
- 4864 W Rose Ln
- 6713 N 56th Ave
- 4813 W Krall St
- 4814 W Rose Ln
- 4729 W Marlette Ave
- 6550 N 47th Ave Unit 113
- 6550 N 47th Ave Unit 194
- 6550 N 47th Ave Unit 196
- 5745 W Maryland Ave Unit 8
- 4734 W Rose Ln
- 4800 W Ocotillo Rd Unit 105
- 6505 N 53rd Ave
- 6509 N 53rd Ave
- 6506 N 52nd Dr
- 6513 N 53rd Ave
- 6510 N 52nd Dr
- 5301 W Maryland Ave
- 6517 N 53rd Ave
- 6514 N 52nd Dr
- 5233 W Maryland Ave
- 6518 N 52nd Dr
- 6521 N 53rd Ave
- 5307 W Maryland Ave
- 6522 N 52nd Dr
- 6525 N 53rd Ave Unit 6
- 6526 N 52nd Dr
- 6501 N 52nd Dr
- 6505 N 52nd Dr
- 6509 N 52nd Dr
- 6529 N 53rd Ave
- 6513 N 52nd Dr