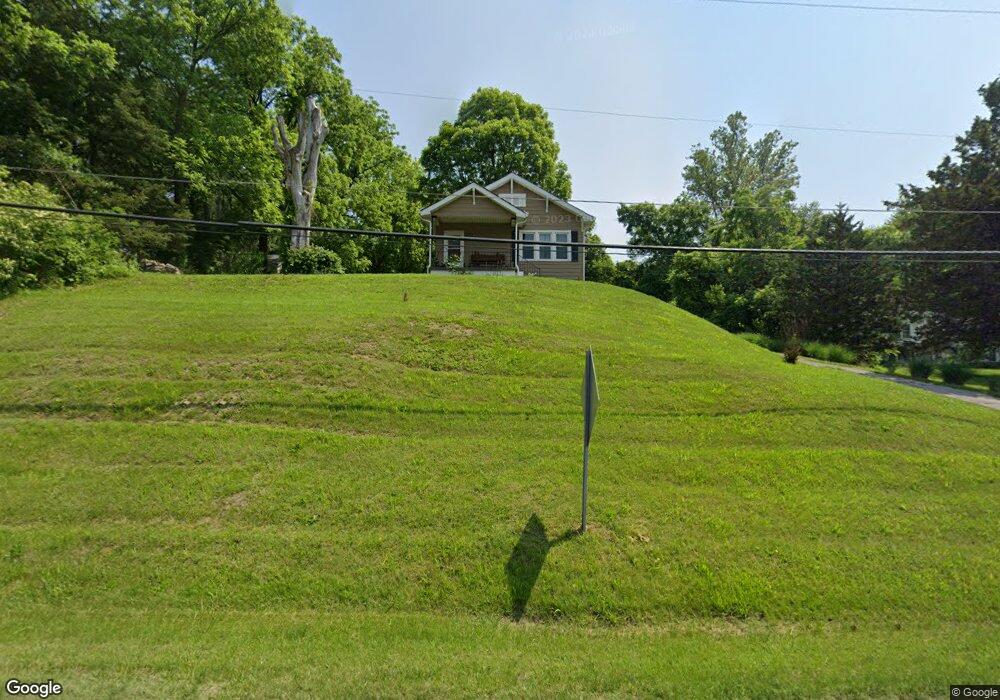
6501 Old Saint Louis Rd Belleville, IL 62223
Estimated Value: $143,000 - $175,388
2
Beds
1
Bath
1,088
Sq Ft
$142/Sq Ft
Est. Value
About This Home
This home is located at 6501 Old Saint Louis Rd, Belleville, IL 62223 and is currently estimated at $154,847, approximately $142 per square foot. 6501 Old Saint Louis Rd is a home located in St. Clair County with nearby schools including Ellis Elementary School, Emge Junior High School, and Our Lady Queen Of Peace Catholic School.
Ownership History
Date
Name
Owned For
Owner Type
Purchase Details
Closed on
Jan 8, 2014
Sold by
Vi Inc
Bought by
Riggins Karen L
Current Estimated Value
Home Financials for this Owner
Home Financials are based on the most recent Mortgage that was taken out on this home.
Original Mortgage
$66,748
Outstanding Balance
$50,119
Interest Rate
4.25%
Mortgage Type
FHA
Estimated Equity
$104,728
Purchase Details
Closed on
Jul 15, 2013
Sold by
County Of Saint Clair
Bought by
Vi Inc
Purchase Details
Closed on
Aug 21, 2009
Sold by
Manwarren Sarah and Manwarren Raymond
Bought by
Manwarren Raymond
Purchase Details
Closed on
Jul 8, 2005
Sold by
Yearian Burnell I
Bought by
Manwarren Raymond and Manwarren Sarah
Home Financials for this Owner
Home Financials are based on the most recent Mortgage that was taken out on this home.
Original Mortgage
$19,540
Interest Rate
5.68%
Mortgage Type
Stand Alone Second
Create a Home Valuation Report for This Property
The Home Valuation Report is an in-depth analysis detailing your home's value as well as a comparison with similar homes in the area
Home Values in the Area
Average Home Value in this Area
Purchase History
| Date | Buyer | Sale Price | Title Company |
|---|---|---|---|
| Riggins Karen L | $68,000 | Town&Country Title Co | |
| Vi Inc | -- | None Available | |
| Manwarren Raymond | -- | None Available | |
| Manwarren Raymond | $98,000 | Town & Country Title Co |
Source: Public Records
Mortgage History
| Date | Status | Borrower | Loan Amount |
|---|---|---|---|
| Open | Riggins Karen L | $66,748 | |
| Previous Owner | Manwarren Raymond | $19,540 | |
| Previous Owner | Manwarren Raymond | $78,160 |
Source: Public Records
Tax History Compared to Growth
Tax History
| Year | Tax Paid | Tax Assessment Tax Assessment Total Assessment is a certain percentage of the fair market value that is determined by local assessors to be the total taxable value of land and additions on the property. | Land | Improvement |
|---|---|---|---|---|
| 2024 | $3,286 | $45,111 | $16,931 | $28,180 |
| 2023 | $3,018 | $40,477 | $15,192 | $25,285 |
| 2022 | $2,815 | $36,731 | $13,786 | $22,945 |
| 2021 | $2,671 | $34,102 | $12,799 | $21,303 |
| 2020 | $2,684 | $33,179 | $12,452 | $20,727 |
| 2019 | $2,664 | $33,179 | $12,452 | $20,727 |
| 2018 | $2,560 | $31,705 | $11,899 | $19,806 |
| 2017 | $1,996 | $29,527 | $11,082 | $18,445 |
| 2016 | $1,512 | $21,124 | $10,634 | $10,490 |
| 2014 | $1,927 | $21,245 | $10,695 | $10,550 |
| 2013 | $2,350 | $23,444 | $11,410 | $12,034 |
Source: Public Records
Map
Nearby Homes
- 22 Terrace Dr
- 6204 Warren Dr
- 57 Cheshire Dr
- 408 Rosewood Ct
- 18 Jonathon Lee Dr
- 11 Pinecrest Cir
- 2819 Frank Scott Pkwy W
- 10 Chamberlain Ct
- 1210 Express Dr
- 905 Blue Ridge Dr
- 130 Hickory Lake
- 317 Southgate Dr
- 2264 Frank Scott Pkwy W
- 69 Country Club Acres
- 2 Winchester Dr
- 4720 Ruth St
- 44 Gatewood Ct
- 27 Chadwick Dr
- 41 Paulette Dr
- 19 S 56th St
- 6429 Old Saint Louis Rd
- 6505 Old Saint Louis Rd
- 6509 Old Saint Louis Rd
- 6500 Old Saint Louis Rd
- 6513 Old Saint Louis Rd
- 6517 Old Saint Louis Rd
- 6415 Old Saint Louis Rd
- 6515 Old Saint Louis Rd
- 6601 Old Saint Louis Rd
- 5 Cheshire Dr
- 17 Flamingo Dr
- 13 Flamingo Dr
- 2 Cheshire Dr
- 9 Flamingo Dr
- 6603 Old Saint Louis Rd
- 5 Flamingo Dr
- 9 Cheshire Dr
- 1 Flamingo Dr
- 21 Flamingo Dr
- 13 Cheshire Dr