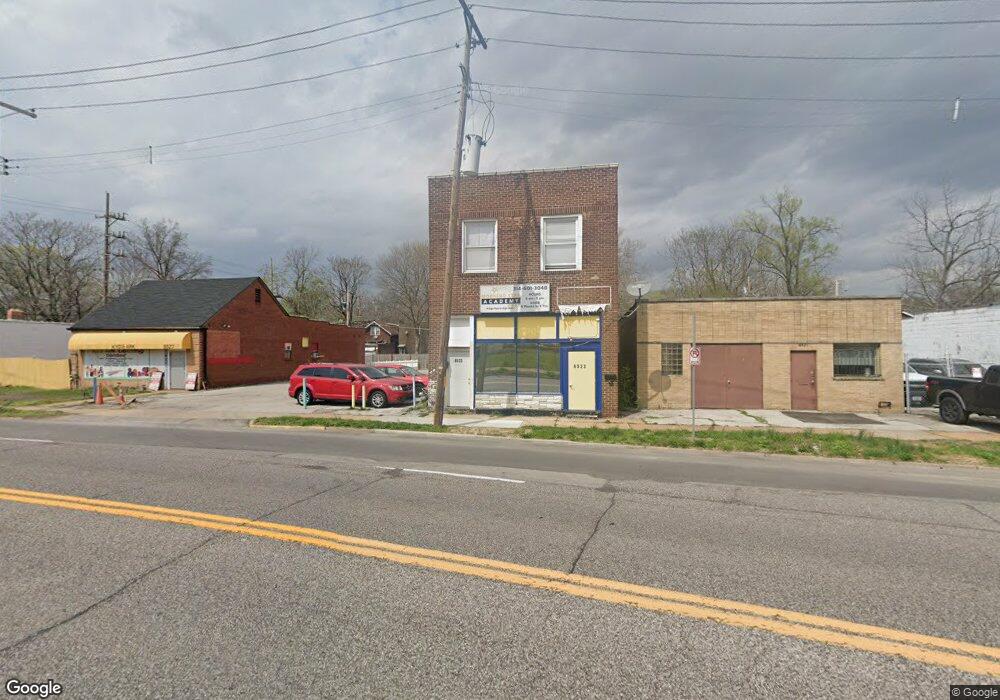
6523 Olive Blvd University City, MO 63130
Estimated Value: $150,462
--
Bed
--
Bath
2,000
Sq Ft
$75/Sq Ft
Est. Value
About This Home
This home is located at 6523 Olive Blvd, University City, MO 63130 and is currently estimated at $150,462, approximately $75 per square foot. 6523 Olive Blvd is a home located in St. Louis County with nearby schools including Pershing Elementary School, Brittany Woods Middle School, and University City High School.
Ownership History
Date
Name
Owned For
Owner Type
Purchase Details
Closed on
Apr 8, 2022
Sold by
Baik and Michelle
Bought by
Baiks Total Group Llc
Current Estimated Value
Purchase Details
Closed on
Dec 14, 2020
Sold by
Olive Boulevard Partnership Llc
Bought by
Baik Sungmin and Nam Jennifer
Purchase Details
Closed on
Jul 29, 1999
Sold by
Cronin Janet E
Bought by
Olive Boulevard Partnership Llc
Home Financials for this Owner
Home Financials are based on the most recent Mortgage that was taken out on this home.
Original Mortgage
$35,000
Interest Rate
7.71%
Mortgage Type
Commercial
Purchase Details
Closed on
May 6, 1999
Sold by
Montgomery Rosalind
Bought by
The Bank Of New York
Purchase Details
Closed on
Oct 20, 1997
Sold by
Montgomery Rosalind
Bought by
National Mtg Consultants
Create a Home Valuation Report for This Property
The Home Valuation Report is an in-depth analysis detailing your home's value as well as a comparison with similar homes in the area
Home Values in the Area
Average Home Value in this Area
Purchase History
| Date | Buyer | Sale Price | Title Company |
|---|---|---|---|
| Baiks Total Group Llc | -- | None Listed On Document | |
| Baik Sungmin | $110,000 | Investors Title Co Clayton | |
| Baik Sungmin | -- | Investors Title | |
| Olive Boulevard Partnership Llc | $55,000 | Capital Title | |
| Cronin Janet E | $34,000 | -- | |
| The Bank Of New York | $59,500 | -- | |
| National Mtg Consultants | -- | -- |
Source: Public Records
Mortgage History
| Date | Status | Borrower | Loan Amount |
|---|---|---|---|
| Previous Owner | Olive Boulevard Partnership Llc | $35,000 |
Source: Public Records
Tax History Compared to Growth
Tax History
| Year | Tax Paid | Tax Assessment Tax Assessment Total Assessment is a certain percentage of the fair market value that is determined by local assessors to be the total taxable value of land and additions on the property. | Land | Improvement |
|---|---|---|---|---|
| 2025 | $2,748 | $31,760 | $5,380 | $26,380 |
| 2024 | $2,748 | $29,810 | $5,380 | $24,430 |
| 2023 | $2,700 | $29,810 | $5,380 | $24,430 |
| 2022 | $2,162 | $22,380 | $5,380 | $17,000 |
| 2021 | $2,040 | $22,380 | $5,380 | $17,000 |
| 2020 | $2,088 | $22,850 | $6,430 | $16,420 |
| 2019 | $2,145 | $22,850 | $6,430 | $16,420 |
| 2018 | $1,973 | $20,700 | $6,430 | $14,270 |
| 2017 | $1,976 | $20,700 | $6,430 | $14,270 |
| 2016 | $2,029 | $20,700 | $6,430 | $14,270 |
| 2015 | $2,067 | $20,700 | $6,430 | $14,270 |
| 2014 | $2,008 | $19,910 | $3,730 | $16,180 |
Source: Public Records
Map
Nearby Homes
- 6518 Chamberlain Ave
- 6522 Bartmer Ave
- 6532 Bartmer Ave
- 6624 Bartmer Ave
- 6634 Chamberlain Ave
- 6525 Bartmer Ave
- 1068 Sutter Ave
- 6512 Etzel Ave
- 6516 Etzel Ave
- 6721 Chamberlain Ave
- 6603 Etzel Ave
- 6264 Cabanne Ave
- 6731 Crest Ave
- 6570 Corbitt Ave
- 6736 Vernon Ave
- 6304 Cates Ave
- 6883 Dartmouth Ave
- 6540 Avalon Ave
- 6568 Plymouth Ave
- 710 Leland Ave
- 6527 Olive Blvd
- 6511 Olive Blvd
- 6520 Chamberlain Ave
- 6522 Chamberlain Ave
- 6514 Chamberlain Ave
- 6526 Chamberlain Ave Unit 3
- 6526 Chamberlain Ave
- 6528 Chamberlain Ave
- 6509 Olive Blvd
- 6509 Olive Blvd Unit 2
- 6510 Chamberlain Ave
- 6530 Chamberlain Ave
- 6508 Chamberlain Ave
- 6508 Chamberlain Ave Unit 2
- 6508 Chamberlain Ave Unit 1
- 6532 Chamberlain Ave
- 6532 Chamberlain Ave Unit 2
- 6532 Chamberlain Ave Unit 1st FL
- 6506 Chamberlain Ave
- 1021 66th St