Estimated Value: $66,000 - $191,000
3
Beds
2
Baths
1,000
Sq Ft
$152/Sq Ft
Est. Value
About This Home
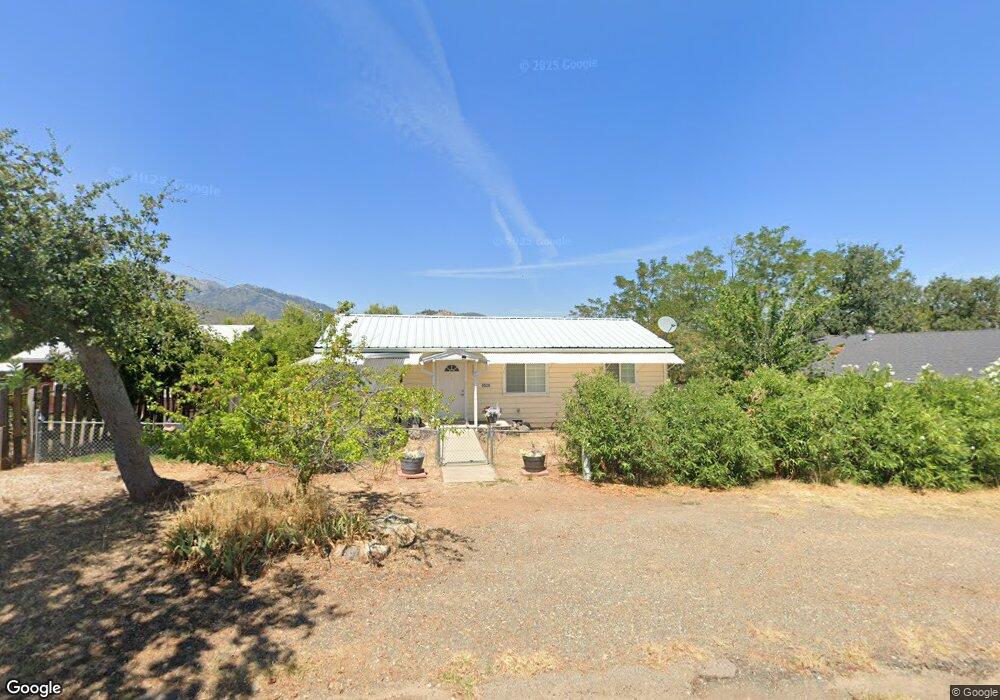
This home is located at 6528 Placer Rd, Igo, CA 96047 and is currently estimated at $152,129, approximately $152 per square foot. 6528 Placer Rd is a home located in Shasta County with nearby schools including Shasta High School.
Ownership History
Date
Name
Owned For
Owner Type
Purchase Details
Closed on
Nov 22, 2013
Sold by
Henrich Eugene M and Henrich Linda R
Bought by
Lisle Michael A and Lisle Bridget E
Current Estimated Value
Purchase Details
Closed on
Aug 6, 2012
Sold by
Henrich Eugene M and Henrich Linda R
Bought by
Henrich Eugene M and Henrich Linda R
Purchase Details
Closed on
Aug 31, 2009
Sold by
Us Bank National Association
Bought by
Henrich Eugene M and Henrich Linda R
Purchase Details
Closed on
Aug 12, 2009
Sold by
Bishop Marcella
Bought by
Us Bank National Association
Purchase Details
Closed on
Aug 18, 2005
Sold by
Medley Robert G and Medley Marilyn M
Bought by
Bishop Marcella
Home Financials for this Owner
Home Financials are based on the most recent Mortgage that was taken out on this home.
Original Mortgage
$159,250
Interest Rate
6.02%
Mortgage Type
Fannie Mae Freddie Mac
Create a Home Valuation Report for This Property
The Home Valuation Report is an in-depth analysis detailing your home's value as well as a comparison with similar homes in the area
Home Values in the Area
Average Home Value in this Area
Purchase History
| Date | Buyer | Sale Price | Title Company |
|---|---|---|---|
| Lisle Michael A | $133,000 | First American Title Company | |
| Henrich Eugene M | -- | None Available | |
| Henrich Eugene M | $90,000 | Lawyers Title | |
| Us Bank National Association | $111,750 | Accommodation | |
| Bishop Marcella | $242,500 | Fidelity Natl Title Co Of Ca |
Source: Public Records
Mortgage History
| Date | Status | Borrower | Loan Amount |
|---|---|---|---|
| Previous Owner | Bishop Marcella | $159,250 |
Source: Public Records
Tax History Compared to Growth
Tax History
| Year | Tax Paid | Tax Assessment Tax Assessment Total Assessment is a certain percentage of the fair market value that is determined by local assessors to be the total taxable value of land and additions on the property. | Land | Improvement |
|---|---|---|---|---|
| 2025 | $686 | $69,291 | $38,328 | $30,963 |
| 2024 | $674 | $67,933 | $37,577 | $30,356 |
| 2023 | $674 | $66,602 | $36,841 | $29,761 |
| 2022 | $656 | $65,297 | $36,119 | $29,178 |
| 2021 | $642 | $64,017 | $35,411 | $28,606 |
| 2020 | $641 | $63,361 | $35,048 | $28,313 |
| 2019 | $624 | $62,119 | $34,361 | $27,758 |
| 2018 | $616 | $60,902 | $33,688 | $27,214 |
| 2017 | $607 | $59,709 | $33,028 | $26,681 |
| 2016 | $573 | $58,539 | $32,381 | $26,158 |
| 2015 | $564 | $57,661 | $31,895 | $25,766 |
| 2014 | $1,419 | $133,000 | $50,000 | $83,000 |
Source: Public Records
Map
Nearby Homes
- 0 Mc Auliffe Rd
- 7870 Castle View Ln
- 7355 Placer Rd
- 7254 Abutment Way
- 8550 Muletown Rd
- 8650 Muletown Rd
- 15086 Vista Knolls Dr
- 7741 Placer Rd
- 15189 La Paloma Way
- 15314 La Paloma Way
- 7891 Placer Rd
- 0 Small Farms Dr Unit OC25228200
- 12562 Bender Rd
- 7954 Placer Rd
- 0 Middletown Park Dr
- 15000 Middletown Park Dr
- 15223 Ledgewood Dr
- 0 Cloverdale Rd Unit SN25180858
- 15333 Mountain Shadows Dr
- 8664 Landmark Cir
- 13998 S Fork Rd
- 13990 S Fork Rd
- 6535 Placer Rd
- 6556 Placer Rd
- 13984 S Fork Rd
- 13972 Southfork Rd
- 13972 South Fork
- 14233 E Igo St
- 13976 S Fork Rd
- 13976 S Fork Rd
- 6490 Placer Rd
- 6491 Placer Rd
- 13972 S Fork Rd
- 6562 Placer Rd
- 6569 Placer Rd
- 6575 Placer Rd
- 6579 Placer Rd
- 6583 Placer Rd
- 6668 Placer Rd
- 000 Placer Rd