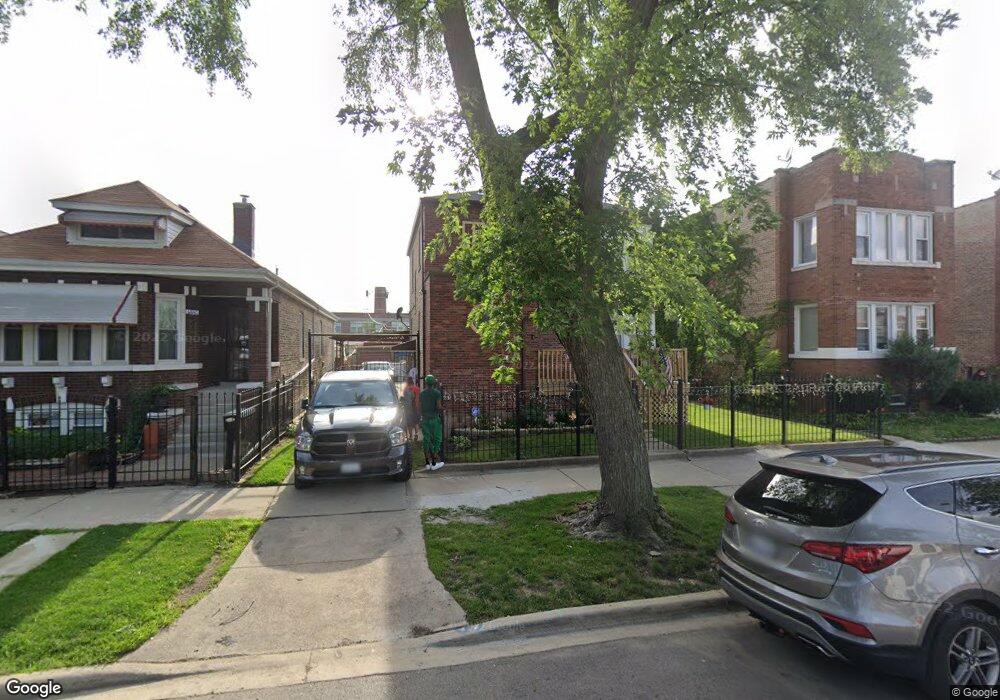
6536 S Francisco Ave Chicago, IL 60629
Marquette Park NeighborhoodEstimated Value: $227,000 - $270,000
3
Beds
2
Baths
1,530
Sq Ft
$162/Sq Ft
Est. Value
About This Home
This home is located at 6536 S Francisco Ave, Chicago, IL 60629 and is currently estimated at $247,398, approximately $161 per square foot. 6536 S Francisco Ave is a home located in Cook County with nearby schools including Marquette School of Excellence, Gage Park High School, and Catalyst Maria Charter School.
Ownership History
Date
Name
Owned For
Owner Type
Purchase Details
Closed on
May 5, 2009
Sold by
Rodriguez Salvador
Bought by
Rodriguez Rosa
Current Estimated Value
Purchase Details
Closed on
Jun 18, 2002
Sold by
Rodriguez Salvador
Bought by
Rodriguez Salvador and Rodriguez Rosa
Purchase Details
Closed on
May 26, 2000
Sold by
Menchaca Job J
Bought by
Rodriguez Salvador
Home Financials for this Owner
Home Financials are based on the most recent Mortgage that was taken out on this home.
Original Mortgage
$99,480
Outstanding Balance
$34,845
Interest Rate
8.13%
Mortgage Type
FHA
Estimated Equity
$212,553
Purchase Details
Closed on
Apr 26, 2000
Sold by
Menchaca Deborah L
Bought by
Menchaca Job J
Home Financials for this Owner
Home Financials are based on the most recent Mortgage that was taken out on this home.
Original Mortgage
$99,480
Outstanding Balance
$34,845
Interest Rate
8.13%
Mortgage Type
FHA
Estimated Equity
$212,553
Create a Home Valuation Report for This Property
The Home Valuation Report is an in-depth analysis detailing your home's value as well as a comparison with similar homes in the area
Home Values in the Area
Average Home Value in this Area
Purchase History
| Date | Buyer | Sale Price | Title Company |
|---|---|---|---|
| Rodriguez Rosa | -- | None Available | |
| Rodriguez Salvador | -- | -- | |
| Rodriguez Salvador | $100,500 | -- | |
| Menchaca Job J | $6,000 | -- |
Source: Public Records
Mortgage History
| Date | Status | Borrower | Loan Amount |
|---|---|---|---|
| Open | Rodriguez Salvador | $99,480 |
Source: Public Records
Tax History Compared to Growth
Tax History
| Year | Tax Paid | Tax Assessment Tax Assessment Total Assessment is a certain percentage of the fair market value that is determined by local assessors to be the total taxable value of land and additions on the property. | Land | Improvement |
|---|---|---|---|---|
| 2024 | $1,345 | $9,422 | $1,563 | $7,859 |
| 2023 | $1,301 | $8,000 | $2,656 | $5,344 |
| 2022 | $1,301 | $8,000 | $2,656 | $5,344 |
| 2021 | $1,274 | $7,999 | $2,656 | $5,343 |
| 2020 | $1,074 | $6,343 | $2,656 | $3,687 |
| 2019 | $1,094 | $7,127 | $2,656 | $4,471 |
| 2018 | $1,075 | $7,127 | $2,656 | $4,471 |
| 2017 | $1,272 | $7,557 | $2,343 | $5,214 |
| 2016 | $1,272 | $7,557 | $2,343 | $5,214 |
| 2015 | $1,153 | $7,557 | $2,343 | $5,214 |
| 2014 | $1,106 | $7,201 | $2,187 | $5,014 |
| 2013 | $1,079 | $7,201 | $2,187 | $5,014 |
Source: Public Records
Map
Nearby Homes
- 6424 S Richmond St
- 6341 S Richmond St
- 3050 W Marquette Rd
- 6351 S California Ave
- 6543 S Washtenaw Ave
- 6424 S Washtenaw Ave
- 6527 S Talman Ave
- 6339 S Troy St
- 6341 S Washtenaw Ave
- 6226 S Francisco Ave
- 6319 S Troy St
- 3217 W 64th Place
- 3219 W 64th St
- 6632 S Maplewood Ave
- 6241 S Troy St
- 6739 S Rockwell St
- 6155 S Whipple St
- 6806 S Rockwell St
- 6734 S Maplewood Ave
- 6221 S Talman Ave
- 6536 S Francisco Ave
- 6532 S Francisco Ave
- 6532 S Francisco Ave Unit 1
- 6540 S Francisco Ave
- 6528 S Francisco Ave
- 6526 S Francisco Ave
- 6544 S Francisco Ave
- 6546 S Francisco Ave
- 6522 S Francisco Ave
- 6535 S Richmond St
- 6539 S Richmond St
- 6550 S Francisco Ave
- 6518 S Francisco Ave
- 6543 S Richmond St
- 6529 S Richmond St
- 6545 S Richmond St
- 6525 S Richmond St
- 6552 S Francisco Ave
- 6516 S Francisco Ave
- 6516 S Francisco Ave