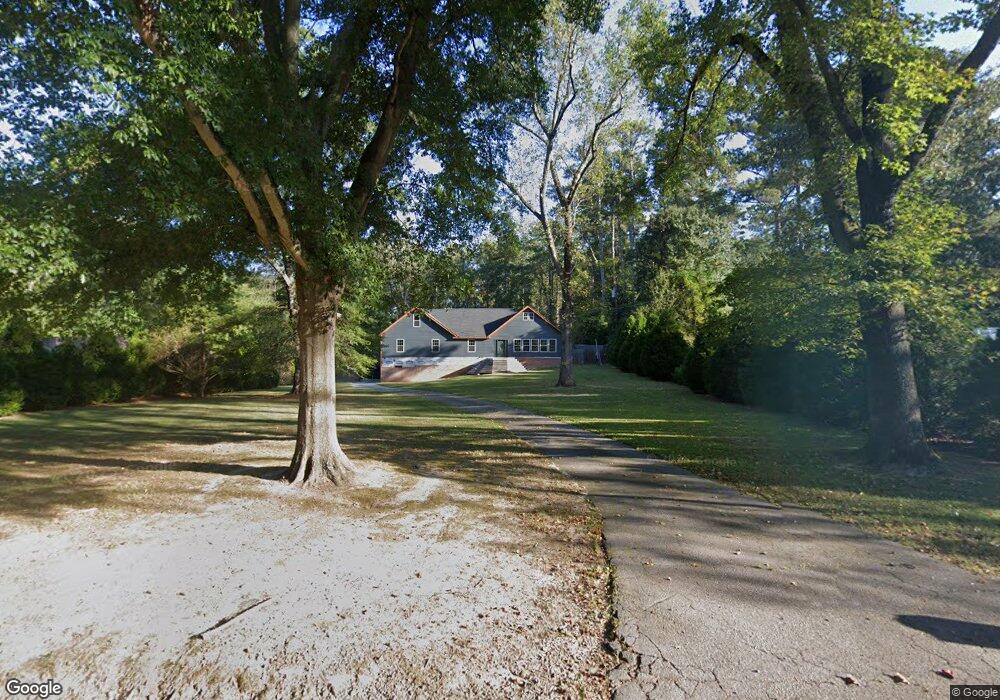
6544 Woodrow Rd Lithonia, GA 30038
Estimated Value: $244,000 - $298,000
4
Beds
3
Baths
1,643
Sq Ft
$160/Sq Ft
Est. Value
About This Home
This home is located at 6544 Woodrow Rd, Lithonia, GA 30038 and is currently estimated at $262,498, approximately $159 per square foot. 6544 Woodrow Rd is a home located in DeKalb County with nearby schools including Flat Rock Elementary School, Lithonia Middle School, and Lithonia High School.
Ownership History
Date
Name
Owned For
Owner Type
Purchase Details
Closed on
Aug 14, 2025
Sold by
Williams Ryan Deon
Bought by
James David J
Current Estimated Value
Purchase Details
Closed on
Mar 21, 2007
Sold by
Pacific Home Mortgage
Bought by
Williams Ryan D
Home Financials for this Owner
Home Financials are based on the most recent Mortgage that was taken out on this home.
Original Mortgage
$155,900
Interest Rate
6.27%
Mortgage Type
Trade
Purchase Details
Closed on
Jul 26, 2006
Sold by
Terragon Equities
Bought by
Pacific Hm Mtg
Purchase Details
Closed on
Dec 6, 2005
Sold by
Williams Spencer A
Bought by
Terragon Equities
Purchase Details
Closed on
Oct 12, 1993
Sold by
Taylor Nancy M Terry
Bought by
Greathouse Daniel Susan
Home Financials for this Owner
Home Financials are based on the most recent Mortgage that was taken out on this home.
Original Mortgage
$94,350
Interest Rate
6.99%
Mortgage Type
VA
Create a Home Valuation Report for This Property
The Home Valuation Report is an in-depth analysis detailing your home's value as well as a comparison with similar homes in the area
Home Values in the Area
Average Home Value in this Area
Purchase History
| Date | Buyer | Sale Price | Title Company |
|---|---|---|---|
| James David J | -- | -- | |
| Williams Ryan D | $155,900 | -- | |
| Pacific Hm Mtg | -- | -- | |
| Terragon Equities | $33,848 | -- | |
| Greathouse Daniel Susan | $92,500 | -- |
Source: Public Records
Mortgage History
| Date | Status | Borrower | Loan Amount |
|---|---|---|---|
| Previous Owner | Williams Ryan D | $155,900 | |
| Previous Owner | Greathouse Daniel Susan | $94,350 |
Source: Public Records
Tax History Compared to Growth
Tax History
| Year | Tax Paid | Tax Assessment Tax Assessment Total Assessment is a certain percentage of the fair market value that is determined by local assessors to be the total taxable value of land and additions on the property. | Land | Improvement |
|---|---|---|---|---|
| 2025 | $5,059 | $103,680 | $15,000 | $88,680 |
| 2024 | $5,004 | $103,200 | $15,000 | $88,200 |
| 2023 | $5,004 | $99,320 | $15,000 | $84,320 |
| 2022 | $3,646 | $75,840 | $10,200 | $65,640 |
| 2021 | $3,236 | $65,480 | $10,200 | $55,280 |
| 2020 | $2,708 | $54,200 | $10,200 | $44,000 |
| 2019 | $2,199 | $42,960 | $10,200 | $32,760 |
| 2018 | $1,611 | $36,920 | $10,200 | $26,720 |
| 2017 | $1,443 | $25,640 | $10,256 | $15,384 |
| 2016 | $1,446 | $25,640 | $10,256 | $15,384 |
| 2014 | $2,181 | $41,240 | $10,440 | $30,800 |
Source: Public Records
Map
Nearby Homes
- 6595 Woodrow Rd
- 3216 Boulder Brook Dr
- 3211 Rockview Dr
- 3231 Boulder Brook Dr
- 6611 Mohave Ct Unit 3
- 6625 Tee Bow Ct
- 6753 Millwood Ln
- 2858 Davidson Dr
- 2635 Evans Mill Dr
- 112 Hillandale Ct
- 6751 Davidson Ct
- 3047 Fields Dr
- 5984 Spring Way
- 6025 Spring Way
- 2801 Klondike Rd
- 3011 Fields Dr
- 6061 Spring Way
- 5985 Spring Way
- 6055 Spring Way
- 6508 Woodrow Rd
- 3031 Bethwood Ln
- 3017 Bethwood Ln
- 6557 Woodrow Rd
- 3003 Bethwood Ln
- 6523 Woodrow Rd
- 3154 Evans Mill Rd
- 2989 Bethwood Ln
- 6490 Woodrow Rd
- 3016 Bethwood Ln
- 3032 Bethwood Ln
- 6488 Woodrow Rd
- 3000 Bethwood Ln
- 3065 Chaparral Place
- 6511 Woodrow Rd Unit 1
- 6472 Evans Mill Way
- 3075 Chaparral Place Unit 3
- 2979 Bethwood Ln
- 2988 Bethwood Ln
- 3100 Evans Mill Rd