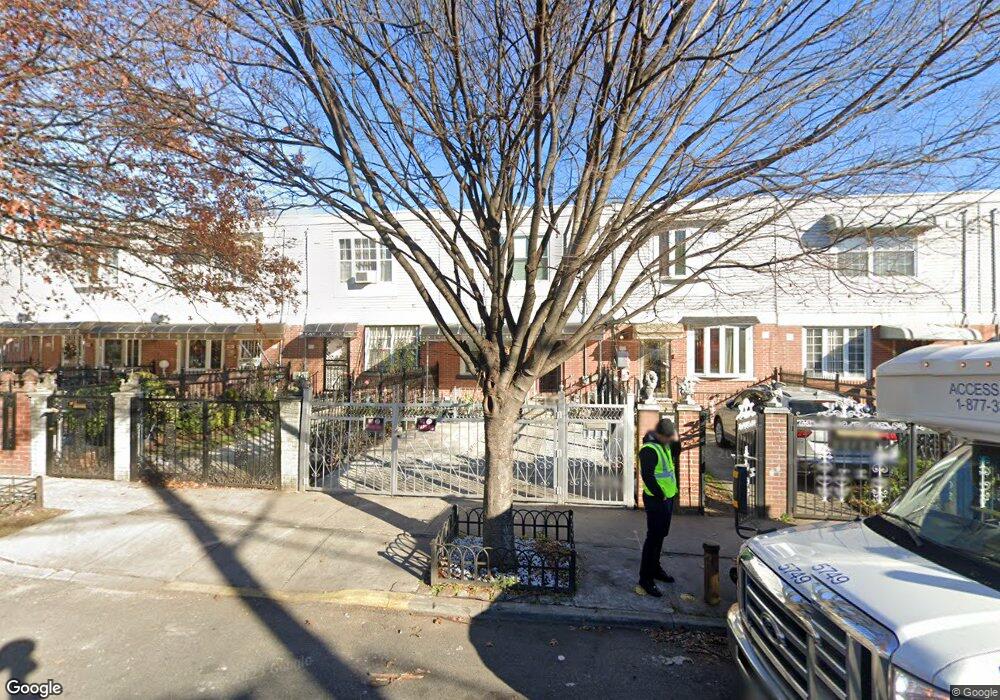
655 Snediker Ave Brooklyn, NY 11207
Brownsville NeighborhoodEstimated Value: $614,523 - $692,000
3
Beds
2
Baths
1,332
Sq Ft
$497/Sq Ft
Est. Value
About This Home
This home is located at 655 Snediker Ave, Brooklyn, NY 11207 and is currently estimated at $662,631, approximately $497 per square foot. 655 Snediker Ave is a home located in Kings County with nearby schools including P.S. 190 - Sheffield, Achievement First - East New York School, and CAMPA Charter School.
Ownership History
Date
Name
Owned For
Owner Type
Purchase Details
Closed on
Aug 16, 2024
Sold by
Kuma Colleen and Kuma Frank
Bought by
Kuma Colleen and Kuma Frank
Current Estimated Value
Purchase Details
Closed on
Sep 11, 2020
Sold by
Estate Of Althea Robinson and Raymond Robinson Jr As Administrator
Bought by
Kuma Colleen and Kuma Frank
Home Financials for this Owner
Home Financials are based on the most recent Mortgage that was taken out on this home.
Original Mortgage
$484,500
Outstanding Balance
$429,962
Interest Rate
2.9%
Mortgage Type
New Conventional
Estimated Equity
$232,669
Purchase Details
Closed on
Mar 18, 2002
Sold by
Nehemiah Housing Develop
Bought by
Dunham-Drayton Althea M
Home Financials for this Owner
Home Financials are based on the most recent Mortgage that was taken out on this home.
Original Mortgage
$77,000
Interest Rate
6.85%
Create a Home Valuation Report for This Property
The Home Valuation Report is an in-depth analysis detailing your home's value as well as a comparison with similar homes in the area
Home Values in the Area
Average Home Value in this Area
Purchase History
| Date | Buyer | Sale Price | Title Company |
|---|---|---|---|
| Kuma Colleen | -- | -- | |
| Kuma Colleen | $510,000 | -- | |
| Kuma Colleen | $510,000 | -- | |
| Dunham-Drayton Althea M | -- | -- | |
| Dunham-Drayton Althea M | -- | -- |
Source: Public Records
Mortgage History
| Date | Status | Borrower | Loan Amount |
|---|---|---|---|
| Open | Kuma Colleen | $484,500 | |
| Closed | Kuma Colleen | $484,500 | |
| Previous Owner | Dunham-Drayton Althea M | $77,000 |
Source: Public Records
Tax History Compared to Growth
Tax History
| Year | Tax Paid | Tax Assessment Tax Assessment Total Assessment is a certain percentage of the fair market value that is determined by local assessors to be the total taxable value of land and additions on the property. | Land | Improvement |
|---|---|---|---|---|
| 2025 | $4,028 | $33,660 | $11,760 | $21,900 |
| 2024 | $4,028 | $34,680 | $11,760 | $22,920 |
| 2023 | $2,839 | $36,720 | $11,760 | $24,960 |
| 2022 | $2,560 | $31,860 | $11,760 | $20,100 |
| 2021 | $3,542 | $27,600 | $11,760 | $15,840 |
| 2020 | $2,656 | $24,900 | $11,760 | $13,140 |
| 2019 | $2,634 | $24,960 | $11,760 | $13,200 |
| 2018 | $2,178 | $15,770 | $6,699 | $9,071 |
| 2017 | $1,809 | $14,878 | $5,807 | $9,071 |
| 2016 | $1,576 | $14,878 | $5,807 | $9,071 |
| 2015 | $235 | $14,764 | $5,693 | $9,071 |
| 2014 | $235 | $13,929 | $4,858 | $9,071 |
Source: Public Records
Map
Nearby Homes
- 1755 Linden Blvd
- 660 Williams Ave Unit 142
- 1753 Linden Blvd
- 650 Williams Ave
- 589 Hinsdale St
- 584 Hinsdale St
- 442 Newport St
- 1825 Linden Blvd
- 610 Alabama Ave
- 606 Alabama Ave
- 90 Louisiana Ave
- 582 Williams Ave
- 578 Williams Ave
- 541 Hinsdale St
- 576 Williams Ave
- 563 Powell St
- 770 Snediker Ave
- 533 Snediker Ave
- 679 Georgia Ave
- 494 Hegeman Ave
- 653 Snediker Ave
- 657 Snediker Ave
- 651 Snediker Ave
- 649 Snediker Ave
- 661 Snediker Ave
- 663 Snediker Ave
- 647 Snediker Ave
- 665 Snediker Ave
- 645 Snediker Ave
- 654 Hinsdale St
- 652 Hinsdale St
- 656 Hinsdale St
- 650 Hinsdale St
- 658 Hinsdale St
- 667 Snediker Ave
- 660 Hinsdale St
- 643 Snediker Ave
- 644 Hinsdale St
- 662 Hinsdale St
- 669 Snediker Ave